• Skip to primary navigation
  • Skip to main content
  • Skip to footer
Bluetab

Bluetab

an IBM Company

  • SOLUTIONS
    • DATA STRATEGY
    • Data Readiness
    • Data Products AI
  • Assets
    • TRUEDAT
    • FASTCAPTURE
    • Spark Tune
  • About Us
  • Our Offices
    • Spain
    • Mexico
    • Peru
    • Colombia
  • talent
    • Spain
    • TALENT HUB BARCELONA
    • TALENT HUB BIZKAIA
    • TALENT HUB ALICANTE
    • TALENT HUB MALAGA
  • Blog
  • EN
    • ES

Bluetab

Databricks on AWS – An Architectural Perspective (part 2)

March 5, 2024 by Bluetab

Databricks on AWS – An Architectural Perspective (part 2)

Rubén Villa

Big Data & Cloud Architect

Jon Garaialde

Cloud Data Solutions Engineer/Architect

Alfonso Jerez

Analytics Engineer | GCP | AWS | Python Dev | Azure | Databricks | Spark

Alberto Jaén

Cloud Engineer | 3x AWS Certified | 2x HashiCorp Certified | GitHub: ajaen4

This article is the second in a two-part series aimed at addressing the integration of Databricks in AWS environments by analyzing the alternatives offered by the product concerning architectural design. The first part discussed topics more related to architecture and networking, while in this second installment, we will cover subjects related to security and general administration.

The contents of each article are as follows:

First installment:

  • Introduction
  • Data Lakehouse & Delta
  • Concepts
  • Architecture
  • Plans and types of workloads
  • Networking

This installment:

  • Security
  • Persistence
  • Billing

The first article can be visited at the following link.

Glossary

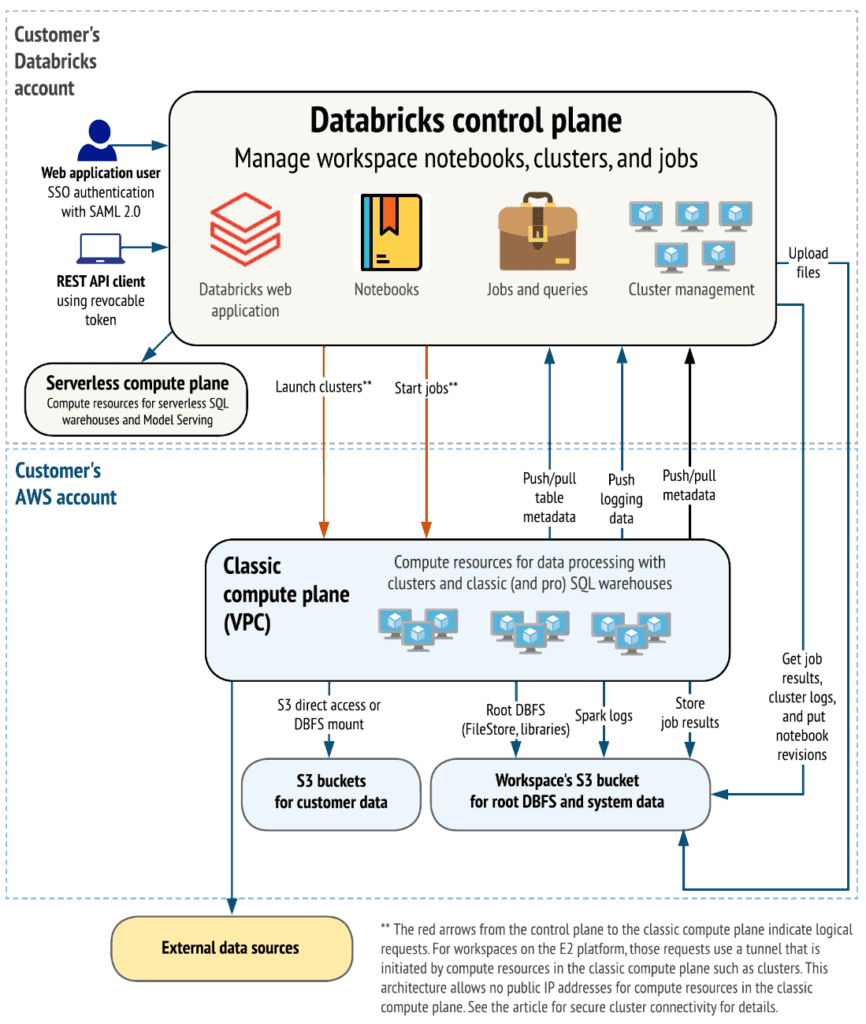
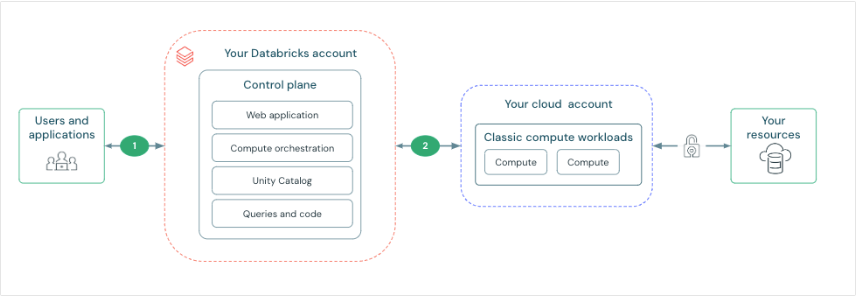
  • Control Plane: Hosts Databricks’ backend services necessary to provide the graphical interface, REST APIs for account and workspaces management. These services are deployed in an AWS account owned by Databricks. Refer to the first article for more information.
  • Credentials Passthrough: Mechanism used by Databricks for managing access to different data sources. Refer to the first article for more information.
  • Cross-account role: Role provided for Databricks to assume from its AWS account. It is used to deploy infrastructure and assume other roles within AWS. Refer to the first article for more information.
  • Compute Plane: Hosts all the infrastructure necessary for data processing: persistence, clusters, logging services, Spark libraries, etc. The Data Plane is deployed in the client’s AWS account. Refer to the first article for more information.
  • Data role: Roles with access/write permissions to S3 buckets that will be assumed by the cluster through the meta instance profile. Refer to the first article for more information.
  • DBFS: Distributed storage system available for clusters. It is an abstraction over an object storage system, in this case, S3, and allows access to files and folders without the need to use URLs. Refer to the first article for more information.
  • IAM Policies: Policies through which access permissions are defined in AWS.
  • Key Management Service (KMS): AWS service that allows creating and managing encryption keys.
  • Pipelines: Series of processes in which a set of data is executed.
  • Prepared: Processed data from raw used as a basis for creating Trusted data.
  • Init Script (User Data Script): EC2 instances launched from Databricks clusters allow including a script to install software updates, download libraries/modules, etc., at the time it starts.
  • Mount: To avoid internally loading the data required for the process, Databricks enables synchronization with external sources, such as S3, to facilitate interaction with different files (simulating that they are local, making relative paths simpler) while actually stored in the corresponding external storage source.
  • Personal Access (PAT) Token: Token for personal authentication that replaces username and password authentication.
  • Raw: Ingested raw data.
  • Root Bucket: Root directory for the workspace (DBFS root). Used to host cluster logs, notebook revisions, and libraries. Refer to the first article for more information.
  • Secret Scope: Environment to store sensitive information through key-value pairs (name – secret)
  • Trusted: Data prepared for visualization and study by different interest groups.
  • Workflows: Sequence of tasks.

Security

Visit Data security and encryption this link

Databricks introduces data security configurations to safeguard information in transit or at rest. The documentation provides a comprehensive overview of the available encryption features. These features encompass:

  • Customer-managed keys for encryption: Enabling the protection and access control of data in the Databricks control plane, including source files of notebooks, notebook results, secrets, SQL queries, and personal access tokens.

  • Encryption of traffic between cluster nodes: Ensuring the security of communication between nodes within the cluster.

  • Encryption of queries and results: Securing the privacy of queries and the stored results.

  • Encryption of S3 buckets at rest: Providing security for data stored in S3 buckets.

It’s essential to highlight that within the support for customer-managed keys:

  • Keys can be configured to encrypt data in the root S3 bucket and EBS volumes of the cluster.

Another capability offered by Databricks is the use of AWS KMS keys to encrypt SQL queries and their history stored in the control plane.

Lastly, it also facilitates the encryption of traffic between cluster nodes and the administration of security configurations for the workspace by administrators.

In this article, we will delve into two of the options: customer-managed keys and the encryption of traffic between cluster worker nodes.

Customer-managed keys

Visit Customer-managed keys this link

Databricks account administrators can configure managed keys for encryption. Two use cases are highlighted for adding a customer-managed key: data from managed services in the Databricks control plane (such as notebooks, secrets, and SQL queries) and workspace storage (root S3 buckets and EBS volumes).

It’s important to note that managed keys for EBS volumes do not apply to serverless compute resources, as these disks are ephemeral and tied to the lifecycle of the serverless workload. In the Databricks documentation, there are comparisons of use cases for customer-managed keys, and it is mentioned that this feature is available in the Enterprise subscription.

Regarding the concept of encryption key configurations, these are account-level objects that reference user cloud keys. Account administrators can create these configurations in the account console and associate them with one or more workspaces. The configuration process involves creating or selecting a symmetric key in AWS KMS and subsequently editing the key policy to allow Databricks to perform encryption and decryption operations. Detailed instructions, along with examples of necessary JSON policies for both use configurations (managed services and workspace storage), can be found in the documentation.

Lastly, there is the option to add an access policy to a cross-account IAM role in AWS, in case the KMS key is in a different account.

Encryption in transit

For this part, it is crucial to emphasize the importance of the init script.

Encryption in transit

  • Encrypt traffic between cluster worker nodes
  • Example init script
  • Use cluster-scoped init scripts

In Databricks, it is crucial to highlight the significance of the init script, which, among other functions, is used to configure encryption between worker nodes in a Spark cluster. This init script enables the retrieval of a shared encryption secret from the key scope stored in DBFS. If the secret is rotated by updating the key store file in DBFS, all running clusters must be restarted to avoid authentication issues between Spark workers and the driver. It’s noteworthy that, since the shared secret is stored in DBFS, any user with access to DBFS can retrieve the secret through a notebook.

While specific AWS instances automatically encrypt data between worker nodes without additional configuration, using the init script provides an added level of security for data in transit or complete control over the type of encryption to be applied.

The script is responsible for obtaining the secret from the key store and its password, as well as configuring the necessary Spark parameters for encryption. Launched as Bash, it performs these tasks and, if necessary, waits until the key store file is available in DBFS and derives the shared encryption secret from the hash of the key store file. Once the initialization of the driver and worker nodes is complete, all traffic between these nodes will be encrypted using the key store file.

These features are part of the Enterprise plan.

Persistence and Metastores

Databricks supports two main types of persistent storage: DBFS (Databricks File System) and S3 (Amazon Simple Storage Service).

DBFS

DBFS is an integrated distributed file system directly connected to Databricks, storing data in the cluster and workspace’s local storage. It provides a file interface similar to standard HDFS, facilitating collaboration by offering a centralized place to store and access data.

S3

On the other hand, Databricks can also connect directly to data stored in Amazon S3. S3 data is independent of clusters and workspaces and can be accessed by multiple clusters and users. S3 stands out for its scalability, durability, and the ability to separate storage and computation, making data access easy even from multiple environments.

Regarding metastores, Databricks on AWS supports various types, including:

Hive Metastore

Databricks can integrate with the Hive metastore, allowing users to use tables and schemas defined in Hive.

Glue Metastore in Data Plane

Databricks also has the option to host the metastore in the compute plane itself with Glue.

These metastores enable users to manage and query table metadata, facilitating schema management and integration with other data services. The choice of metastore will depend on the specific workflow requirements and metadata management preferences in the Databricks environment on AWS.

Unity Catalog

Undoubtedly, a new feature of Databricks that unifies these previous metastores and enhances the various options and tools each of them offers is the Unity Catalog.


Unity Catalog provides centralized capabilities for access control, auditing, lineage, and data discovery.

Key Features of Unity Catalog:

  • Manages data access policies in a single location that apply to all defined workspaces.
  • Based on ANSI SQL, it allows administrators to grant these permissions using SQL syntax.
  • Automatically captures user-level audit logs.
  • Enables labeling tables and schemas, providing an efficient search interface to find information.

Databricks recommends configuring all access to cloud object storage through Unity Catalog to manage relationships between data in Databricks and cloud storage.

Unity Catalog Object Model

  • Metastore: Top-level metadata container, exposes a three-level namespace (catalog.schema.table).
  • Catalog: Organizes data assets, the first layer in the hierarchy.
  • Schema: Second layer, organizes tables and views.
  • Tables, Views, and Volumes: Lower levels, with volumes providing non-tabular access to data.
  • Models: Not data assets, record machine learning models.

Billing

Here is a detailed explanation of Databricks’ function on AWS that enables the delivery and access to billable usage logs. Account administrators can configure the daily delivery of CSV logs to an AWS S3 bucket. Each CSV file provides historical data on the usage of clusters in Databricks, categorizing them by criteria such as cluster ID, billing SKU, cluster creator, and tags. The delivery includes logs for both running workspaces and those canceled, ensuring the proper representation of the last day of such a workspace (it must have been operational for at least 24 hours).

The setup involves creating an S3 bucket and an IAM role in AWS, along with calling the Databricks API to set up storage configuration objects and credentials. The cross-account support option allows delivery to different AWS accounts through an S3 bucket policy. CSV files are located at <bucket-name>/<prefix>/billable-usage/csv/, and it is advisable to review S3 security best practices.

The account API allows shared configurations for all workspaces or separate configurations for each space or group. The delivery of these CSVs enables account owners to directly download the logs. The S3 object ownership is auto-configured as “Bucket owner preferred” to support ownership of newly created objects.

There is a limit on the number of log delivery configurations, and one needs to be an account administrator, providing the account ID. Extra caution is required when configuring the S3 object property as “Object writer” instead of “Bucket owner preferred” due to potential access difficulties.

Fields Description
workspaceId
Workspace Id
timestamp
Established frequency (hourly, daily,…)
clusterId
Cluster Id
clusterName
Name assigned to the Cluster
clusterNodeType
Type of node assigned
clusterOwnerUserId
Cluster creator user id
clusterCustomTags
Customizable cluster information labels
sku
Package assigned by Databricks in relation to the cluster characteristics.
dbus
DBUs consumption per machine hour
machineHours
Cluster deployment machine hours
clusterOwnerUserName
Username of the cluster creator
tags
Customizable cluster information labels

Referencias

  1. https://bluetab.net/es/databricks-sobre-aws-una-perspectiva-de-arquitectura-parte-1/ 
  2. https://docs.databricks.com/en/security/keys/index.html | 2024-02-06
  3. https://docs.databricks.com/en/security/keys/customer-managed-keys.html |  2024-02-06
  4. https://docs.databricks.com/en/security/keys/encrypt-otw.html | 2024-02-24
  5. https://docs.databricks.com/en/security/keys/encrypt-otw.html#example-init-script |  2024-02-24
  6. https://docs.databricks.com/en/init-scripts/cluster-scoped.html |  2023-12-05
  7. https://docs.databricks.com/en/data-governance/unity-catalog/index.html | 2024-02-26
 

Navegación

Do you want to know more about what we offer and to see other success stories?
DISCOVER BLUETAB

Rubén Villa

Big Data & Cloud Architect

Alfonso Jerez

Analytics Engineer | GCP | AWS | Python Dev | Azure | Databricks | Spark

Jon Garaialde

Cloud Data Solutions Engineer/Architect

Alberto Jaén

Cloud Engineer | 3x AWS Certified | 2x HashiCorp Certified | GitHub: ajaen4

SOLUTIONS, WE ARE EXPERTS
DATA STRATEGY
DATA FABRIC
AUGMENTED ANALYTICS
You may be interested in

Gobierno del Dato: Una mirada en la realidad y el futuro

May 18, 2022
LEER MÁS

Bluetab is certified under the AWS Well-Architected Partner Program

October 19, 2020
LEER MÁS

Myths and truths of software engineers

June 13, 2022
LEER MÁS

Desplegando una plataforma CI/CD escalable con Jenkins y Kubernetes

September 22, 2021
LEER MÁS

Snowflake, el Time Travel sin DeLorean para unos datos Fail-Safe.

February 23, 2023
LEER MÁS

Data Mesh

July 27, 2022
LEER MÁS

Filed Under: Blog, Practices, Tech

Databricks on AWS – An Architectural Perspective (part 1)

March 5, 2024 by Bluetab

Databricks on AWS – An Architectural Perspective (part 1)

Jon Garaialde

Cloud Data Solutions Engineer/Architect

Rubén Villa

Big Data & Cloud Architect

Alfonso Jerez

Analytics Engineer | GCP | AWS | Python Dev | Azure | Databricks | Spark

Alberto Jaén

Cloud Engineer | 3x AWS Certified | 2x HashiCorp Certified | GitHub: ajaen4

Databricks has become a reference product in the field of unified analytics platforms for creating, deploying, sharing, and maintaining data solutions, providing an environment for engineering and analytical roles. Since not all organizations have the same types of workloads, Databricks has designed different plans that allow adaptation to various needs, and this has a direct impact on the architecture design of the platform.

With this series of articles, the goal is to address the integration of Databricks in AWS environments, analyzing the alternatives offered by the product in terms of architecture design. Additionally, the advantages of the Databricks platform itself will be discussed. Due to the extensive content, it has been considered convenient to divide them into three parts:

First installment:

  1. Introduction.
  2. Data Lakehouse & Delta.
  3. Concepts.
  4. Architecture.
  5. Plans and types of workloads.
  6. Networking.

Second installment:

  1. Security.
  2. Persistence.
  3. Billing.

Introduction

Databricks is created with the idea of developing a unified environment where different profiles, such as Data Engineers, Data Scientists, and Data Analysts, can collaboratively work without the need for external service providers to offer the various functionalities each one needs in their daily tasks.

Databricks’ workspace provides a unified interface and tools for a variety of data tasks, including:

  • Programming and administration of data processing.
  • Dashboard generation and visualizations.
  • Management of security, governance, high availability, and disaster recovery.
  • Data exploration, annotation, and discovery.
  • Modeling, monitoring, and serving of Machine Learning (ML) models.
  • Generative AI solutions.

The birth of Databricks is made possible through the collaboration of the founders of Spark, who released Delta Lake and MLFlow as Databricks products following the open-source philosophy.

Spark, Delta Lake and MLFlow partnership

This new collaborative environment had a significant impact upon its introduction due to the innovations it offered by integrating different technologies:

  • Spark: A distributed programming framework known for its ability to perform queries on Delta Lakes at cost/time ratios superior to competitors, optimizing the analysis processes.

  • Delta Lake: Positioned as Spark’s storage support, Delta Lake combines the main advantages of Data Warehouses and Data Lakes by enabling the loading of both structured and unstructured information. It uses an enhanced version of Parquet that supports ACID transactions, ensuring the integrity of information in ETL processes carried out by Spark.

  • MLFlow: A platform for managing the end-to-end lifecycle of Machine Learning, including experimentation, reusability, centralized model deployment, and logging.

Data Lakehouse & Delta

A Data Lakehouse is a data management system that combines the benefits of Data Lakes and Data Warehouses.

Diagrama de un Data Lakehouse (fuente: Databricks)

A Data Lakehouse provides scalable storage and processing capabilities for modern organizations aiming to avoid isolated systems for processing different workloads such as Machine Learning (ML) and Business Intelligence (BI). A Data Lakehouse can help establish a single source of truth, eliminate redundant costs, and ensure data freshness.

Data Lakehouses employ a data design pattern that gradually enhances and refines data as it moves through different layers. This pattern is often referred to as a medallion architecture.

Databricks relies on Apache Spark, a highly scalable engine that runs on compute resources decoupled from storage.

Databricks’ Data Lakehouse utilizes two key additional technologies:

  1. Delta Lake: An optimized storage layer that supports ACID transactions and schema enforcement.
  2. Unity Catalog: A unified and detailed governance solution for data and artificial intelligence.


Data Design Pattern:

Data Ingestion: In the ingestion layer, data arrives from various sources in batches or streams, in a wide range of formats. This initial stage provides an entry point for raw data. By converting these files into Delta tables, Delta Lake’s schema enforcement capabilities can be leveraged to identify and handle missing or unexpected data. Unity Catalog can be used to efficiently manage and log these tables based on data governance requirements and necessary security levels, allowing tracking of data lineage as it transforms and refines.

Processing, Cleaning, and Data Integration: After data verification, selection, and refinement take place. In this stage, data scientists and machine learning professionals often work with the data to combine, create new features, and complete cleaning. Once the data is fully cleaned, it can be integrated and reorganized into tables designed to meet specific business needs. The write-schema approach, along with Delta’s schema evolution capabilities, allows changes in this layer without rewriting the underlying logic providing data to end users.

Data Serving: The final layer provides clean and enriched data to end users. The end tables should be designed to meet all usage needs. Thanks to a unified governance model, data lineage can be tracked back to its single source of truth. Optimized data designs for various tasks enable users to access data for machine learning applications, data engineering, business intelligence, and reporting.


Features:

  • The Data Lakehouse concept leverages a Data Lake to store a wide variety of data in low-cost storage systems, such as Amazon S3 in this case.
  • Catalogs and schemas are used to provide governance and auditing mechanisms, allowing Data Manipulation Language (DML) operations through various languages, and storing change histories and data snapshots. Role-based access controls are applied to ensure security.
  • Performance and scalability optimization techniques are employed to ensure efficient system operation.
  • It allows the use of unstructured and non-SQL data, facilitating information exchange between platforms using open-source formats like Parquet and ORC, and offering APIs for efficient data access.
  • Provides end-to-end streaming support, eliminating the need for dedicated systems for real-time applications. This is complemented by parallel massive processing capabilities to handle diverse workloads and analyses efficiently.

Concepts: Account & Workspaces

In Databricks, a workspace is an implementation of Databricks in the cloud that serves as an environment for your team to access Databricks assets. You can choose to have multiple workspaces or just one, depending on your needs.

A Databricks account represents a single entity that can include multiple workspaces. Unity Catalog-enabled accounts can be used to centrally manage users and their data access across all workspaces in the account. Billing and support are also handled at the account level.

Billing: Databricks Units (DBUs)

Databricks invoices are based on Databricks Units (DBUs), processing capacity units per hour based on the type of VM instance.

Authentication & Authorization

Concepts related to Databricks identity management and access to Databricks assets.

  • User: A unique individual with access to the system. User identities are represented by email addresses.

  • Service Principal: Service identity for use with jobs, automated tools, and systems like scripts, applications, and CI/CD platforms. Service entities are represented by an application ID.

  • Group: A collection of identities. Groups simplify identity management, making it easier to assign access to workspaces, data, and other objects. All Databricks identities can be assigned as group members.

  • Access control list (ACL): A list of permissions associated with the workspace, cluster, job, table, or experiment. An ACL specifies which users or system processes are granted access to objects and what operations are allowed on the assets. Each entry in a typical ACL specifies a principal and an operation.

  • Personal access token: A opaque string for authenticating with the REST API, SQL warehouses, etc.

  • UI (User Interface): Databricks user interface, a graphical interface for interacting with features such as workspace folders and their contained objects, data objects, and computational resources.

Data Science & Engineering

Tools for data engineering and data science collaboration.

  • Workspace: An environment to access all Databricks assets, organizing objects (Notebooks, libraries, dashboards, and experiments) into folders and providing access to data objects and computational resources.

  • Notebook: A web-based interface for creating data science and machine learning workflows containing executable commands, visualizations, and narrative text.

  • Dashboard: An interface providing organized access to visualizations.

  • Library: A available code package that runs on the cluster. Databricks includes many libraries, and custom ones can be added.

  • Repo: A folder whose contents are versioned together by synchronizing them with a remote Git repository. Databricks Repos integrates with Git to provide source code control and versioning for projects.

  • Experiment: A collection of MLflow runs to train a machine learning model.

Databricks Interfaces

Describes the interfaces Databricks supports in addition to the user interface to access its assets: API and Command Line Interface (CLI).

  • REST API: Databricks provides API documentation for the workspace and account.

  • CLI: Open-source project hosted on GitHub. The CLI is based on Databricks REST API.

Data Management

Describes objects containing the data on which analysis is performed and feeds machine learning algorithms.

  • Databricks File System (DBFS): Abstraction layer over a blob store. It contains directories, which can hold files (data files, libraries, and images) and other directories.

  • Database: A collection of data objects such as tables or views and functions, organized for easy access, management, and updating.

  • Table: Representation of structured data.

  • Delta table: By default, all tables created in Databricks are Delta tables. Delta tables are based on the open-source Delta Lake project, a framework for high-performance ACID table storage in cloud object stores.

  • Metastore: Component storing all the structure information of different tables and partitions in the data store, including column and column type information, serializers and deserializers needed to read and write data, and the corresponding files where data is stored.

  • Visualization: Graphical representation of the result of executing a query.

Computation Management

Describes concepts for executing computations in Databricks.

  • Cluster: A set of configurations and computing resources where Notebooks and jobs run. There are two types of clusters: all-purpose and job.

    • An all-purpose cluster is created manually through the UI, CLI, or REST API and can be manually terminated and restarted.

    • A job cluster is created when running a job on a new job cluster and terminates when the job is completed. Job clusters cannot be restarted.

  • Pool: A set of instances ready for use that reduces cluster start times and enables automatic scaling. When attached to a pool, a cluster assigns driver and worker nodes to the pool. If the pool doesn’t have enough resources to handle the cluster’s request, the pool expands by assigning new instances from the instance provider.

  • Databricks Runtime: A set of core components running on clusters managed by Databricks. There are several runtimes available:

    • Databricks runtime includes Apache Spark and adds components and updates to improve usability, performance, and security.

    • Databricks runtime for Machine Learning is based on Databricks runtime and provides a pre-built machine learning infrastructure that integrates with all Databricks workspace capabilities.

Workflows

Frameworks for developing and running data processing pipelines:

  • Jobs: Non-interactive mechanism to run a Notebook or library either immediately or on a schedule.

  • Delta Live Tables: Framework for creating reliable, maintainable, and auditable data processing pipelines.

  • Workload: Databricks identifies two types of workloads subject to different pricing schemes:

    • Data Engineering (job): An (automated) workload running on a job cluster that Databricks creates for each workload.

    • Data Analysis (all-purpose): An (interactive) workload running on an all-purpose cluster. Interactive workloads typically execute commands within Databricks Notebooks.

  • Execution context: State of a Read-Eval-Print Loop (REPL) environment for each supported programming language. Supported languages are Python, R, Scala, and SQL.

Machine Learning

End-to-end integrated environment incorporating managed services for experiment tracking, model training, function development and management, and serving functions and models.

  • Experiments: Primary unit of organization for tracking the development of machine learning models.

  • Feature Store: Centralized repository of features enabling sharing and discovery of functions across the organization, ensuring the same function calculation code is used for both model training and inference.

  • Models & model registry: Machine learning or deep learning model registered in the model registry.

SQL

  • SQL REST API: Interface allowing automation of tasks on SQL objects.

  • Dashboard: Representation of data visualizations and comments.

  • SQL queries: SQL queries in Databricks.

    • Query: SQL query.

    • SQL warehouse: SQL storage.

    • Query history: History of queries.

Architecture: High-level architecture

Before we start analyzing the various alternatives that Databricks offers for infrastructure deployment, it is advisable to understand the main components of the product. Below is a high-level overview of the Databricks architecture, including its enterprise architecture, in conjunction with AWS.

High-level Architecture Diagram (source: Databricks)

Although architectures may vary based on custom configurations, the above diagram represents the structure and most common data flow for Databricks in AWS environments.

The diagram outlines the general architecture of the classic compute plane. Regarding the architecture for the serverless compute plane used for serverless SQL pools, the compute layer is hosted in a Databricks account instead of an AWS account.

Control plane and compute plane:

Databricks is structured to enable secure collaboration in multifunctional teams while maintaining a significant number of backend services managed by Databricks. This allows you to focus on data science, data analysis, and data engineering tasks.

  • The control plane includes backend services that Databricks manages in its Databricks account. Notebooks and many other workspace configurations are stored in the control plane and encrypted at rest.
  • The compute plane is where data is processed.

For most Databricks computations, computing resources are in your AWS account, referred to as the classic compute plane. This pertains to the network in your AWS account and its resources. Databricks uses the classic compute plane for its Notebooks, jobs, and classic and professional Databricks SQL pools.

As mentioned earlier, for serverless SQL pools, serverless computing resources run in a serverless compute plane in a Databricks account.

Databricks has numerous connectors to link clusters to external data sources outside the AWS account for data ingestion or storage. These connectors also facilitate ingesting data from external streaming sources such as event data, streaming data, IoT data, etc.

The Data Lake is stored at rest in the AWS account and in the data sources themselves to maintain control and ownership of the data.

E2 Architecture:

The E2 platform provides features like:

  • Multi-workspace accounts.
  • Customer-managed VPCs: Creating Databricks workspaces in your VPC instead of using the default architecture where clusters are created in a single AWS VPC that Databricks creates and configures in your AWS account.
  • Secure cluster connectivity: Also known as “No Public IPs,” secure cluster connectivity allows launching clusters where all nodes have private IP addresses, providing enhanced security.
  • Customer-managed keys: Provide KMS keys for data encryption.
 

Workload plans and types

The price indicated by Databricks is attributed in relation to the DBUs consumed by the clusters. This parameter is associated with the processing capacity consumed by the clusters and directly depends on the type of instances selected (when configuring the cluster, an approximate calculation of the DBUs it will consume per hour is provided).

The price charged per DBU depends on two main factors:

  1. Computational factor: the definition of cluster characteristics (Cluster Mode, Runtime, On-Demand-Spot Instances, Autoscaling, etc.) that will result in the allocation of a specific package.

  2. Architecture factor: customization of this (Customer Managed-VPC), in some aspects may require a Premium or even Enterprise subscription, causing the cost of each DBU to be higher as you obtain a subscription with greater privileges.

The combination of both computational and architectural factors will determine the final cost of each DBU per hour of operation.

All information regarding plans and types of work can be found at the following link

Networking

Databricks has an architecture divided into control plane and compute plane. The control plane includes backend services managed by Databricks, while the compute plane processes the data. For classic computing and calculation, resources are in the AWS account in a classic compute plane. For serverless computing, resources run on a serverless compute plane in the Databricks account.

Thus, Databricks provides secure network connectivity by default, but additional features can be configured. Key points include:

  • Connection between users and Databricks: This can be controlled and configured for private connectivity. Configurable features include:

    • Authentication and access control.
    • Private connection.
    • Access IP list.
    • Firewall rules.
  • Network connectivity features for the control plane and compute plane. Connectivity between the control plane and the serverless compute plane is always done through the cloud network, not over the public Internet. This approach focuses on establishing and securing the connection between the control plane and the classic compute plane. The concept of ‘secure cluster connectivity’ is worth noting, where, when enabled, the client’s virtual networks have no open ports, and Databricks cluster nodes do not have public IP addresses, simplifying network management. Additionally, there is the option to deploy a workspace within the Virtual Private Cloud (VPC) on AWS, providing greater control over the AWS account and limiting outbound connections. Other topics include the possibility of pairing the Databricks VPC with another AWS VPC for added security, and enabling private connectivity from the control plane to the classic compute plane through AWS PrivateLink.”

The following link is provided for more information on these specific features.


Connections through Private Network (Private Links)

Finally, we want to highlight how AWS uses PrivateLinks to establish private connectivity between users and Databricks workspaces, as well as between clusters and the infrastructure of the workspaces.

AWS PrivateLink provides private connectivity from AWS VPCs and on-premises networks to AWS services without exposing the traffic to the public network. In Databricks, PrivateLink connections are supported for two types of connections: Front-end (users to workspaces) and back-end (control plane to control plane).

The front-end connection allows users to connect to the web application, REST API, and Databricks Connect through a VPC interface endpoint.

The back-end connection means that Databricks Runtime clusters in a customer-managed VPC connect to the central services of the workspace in the Databricks account to access the REST APIs.

Both PrivateLink connections or only one of them can be implemented.

Referencias

What is a data lakehouse? [link] (January 18, 2024)

Databricks concepts [link] (January 31, 2024)

Architecture [link] (December 18, 2023)

Users to Databricks networking [link] (February 7, 2024)

Secure cluster connectivity [link] (January 23, 2024)

Enable AWS PrivateLink [link] (February 06, 2024)

Navegación

Do you want to know more about what we offer and to see other success stories?
DISCOVER BLUETAB

Jon Garaialde

Cloud Data Solutions Engineer/Architect

Alfonso Jerez

Analytics Engineer | GCP | AWS | Python Dev | Azure | Databricks | Spark

Rubén Villa

Big Data & Cloud Architect

Alberto Jaén

Cloud Engineer | 3x AWS Certified | 2x HashiCorp Certified | GitHub: ajaen4

SOLUTIONS, WE ARE EXPERTS
DATA STRATEGY
DATA FABRIC
AUGMENTED ANALYTICS
You may be interested in

Starburst: Construyendo un futuro basado en datos.

May 25, 2023
LEER MÁS

LakeHouse Streaming on AWS with Apache Flink and Hudi (Part 2)

October 4, 2023
LEER MÁS

Boost Your Business with GenAI and GCP: Simple and for Everyone

March 27, 2024
LEER MÁS

Container vulnerability scanning with Trivy

March 22, 2024
LEER MÁS

Hashicorp Boundary

December 3, 2020
LEER MÁS

LakeHouse Streaming on AWS with Apache Flink and Hudi (Part 1)

April 11, 2023
LEER MÁS

Filed Under: Blog, Practices, Tech

INCREASING THE CAPABILITIES OF ARTIFICIAL INTELLIGENCE USAGE WITHIN THE ORGANIZATION

November 7, 2023 by Bluetab

INCREASING THE CAPABILITIES OF ARTIFICIAL INTELLIGENCE USAGE WITHIN THE ORGANIZATION

In all industries, we have seen how DevOps and DataOps have been widely adopted as methodologies to improve the quality and reduce time-to-market for software engineering and data engineering initiatives, respectively. However, the debate on MLOps often focuses exclusively on tools, overlooking a critical aspect of the success of Machine Learning (ML) investment – enabling individuals to achieve their goals. This implies designing the appropriate structure for your organization.

Furthermore, it is essential to consider the unique aspects of machine learning, and how the general principles of software development may not always be applicable to these projects.

  • Why does Bluetab believe this is important?

In this paper, we explain why it is important to increase the capabilities of artificial intelligence usage in organizations.

Download it here!

SOLUCIONES, SOMOS EXPERTOS

DATA STRATEGY
DATA FABRIC
AUGMENTED ANALYTICS

Te puede interesar

Filed Under: pow, pow

MICROSOFT FABRIC: Una nueva solución de análisis de datos, todo en uno

October 16, 2023 by Bluetab

MICROSOFT FABRIC: Una nueva solución de análisis de datos, todo en uno

Deygerson Méndez

Data Engineer

En el dinámico mundo empresarial actual; la tecnología es la clave para la innovación y el éxito. Por ello, si estás buscando una forma fresca y emocionante de potenciar las capacidades de análisis de datos de tu organización, estás en el lugar correcto.

En el siguiente artículo te contaremos desde bluetab, nuestra experiencia sobre Microsoft Fabric, la nueva solución de análisis que nos ofrece este big player tecnológico. Con ella podemos abarcar todo el ciclo de vida del dato, es decir, desde el movimiento de datos pudiendo crear pipelines para la ingesta, hasta la transformación y carga de los mismos. A su vez, el análisis en tiempo real, la inteligencia empresarial, la gobernanza y el cumplimiento, todo ello en un mismo espacio de trabajo; además de contar con herramientas de inteligencia artificial integradas, que nos ayudan a generar soluciones basadas en información en un menor tiempo.


¿Qué es Microsoft Fabric?

La documentación oficial de Microsoft describe el servicio como “no es solo otra solución tecnológica, sino una plataforma integral diseñada para simplificar y optimizar sus procesos empresariales mediante una infraestructura moderna, la cual se presenta, como una solución altamente integrada y fácil de usar”. 

Microsoft Fabric está basado, en un modelo de Software como Servicio (SaaS) que lleva la simplicidad y la integración a un siguiente nivel. 

A la vez, ofrece un conjunto completo de servicios, que incluye un lago de datos unificado denominado OneLake, que permite mantener los datos en su lugar mientras utiliza sus herramientas de análisis preferidas, e incorpora servicios nuevos y existentes como Power BI, Azure Synapse Analytics y Azure Data Factory en un entorno unificado.

Es importante mencionar que está integración nos ofrece grandes ventajas, como, por ejemplo:

  • Amplia gama de capacidades integradas: Esto quiere decir que proporciona una suite completa de capacidades de análisis profundamente integradas, abarcando desde la ingeniería de datos, la ciencia de datos y el análisis en tiempo real.
  • Toma decisiones informadas: Gracias a la analítica avanzada de Microsoft Fabric, podrá tomar decisiones basadas en datos sólidos, impulsando así su estrategia empresarial.
  • Más eficiencia, menos esfuerzo: Al automatizar procesos repetitivos, Microsoft Fabric le libera para que pueda concentrarse en tareas más importantes y creativas.
  • Colaboración sin fronteras: La capacidad de colaborar en tiempo real entre equipos, independientemente de su ubicación, fomenta la creatividad y la innovación.
  • Gestión y gobernanza centralizadas: Con una sólida administración, Microsoft Fabric ofrece gobernanza y control en todas las experiencias.


Herramientas especializadas para cada necesidad:

Conviene especificar que, Microsoft Fabric nos ofrece un conjunto completo de experiencias de análisis diseñadas para trabajar conjuntamente sin problemas, cada una de ellas se adapta a un rol y tarea específica:

  • OneLake: Proporciona una ubicación unificada para almacenar todos los datos de la organización, donde se dan las experiencias. 


  • Synapse Data Warehousing: Ofrece un rendimiento líder en SQL y separa el proceso de almacenamiento, escalando independientemente cada componente.

Synapse Data Engineering: Proporciona una plataforma Spark de primer nivel, para transformar datos a gran escala y democratizar el uso de los datos.

  • Data Factory: Combina la simplicidad de Power Query con la potencia de Azure Data Factory, conectándote a más de 200 orígenes de datos.
  • Synapse Data Science: Permite crear, implementar y desplegar modelos de aprendizaje automático con facilidad, conectándose a Azure Machine Learning.
  • Synapse Real-Time Analytics: Puede transmitir grandes volúmenes de datos a la base de datos de KQL, con una latencia de pocos segundos, después usar un conjunto de consultas KQL para analizar y visualizar los resultados en informes de Power BI.
  • Power BI: La plataforma líder en inteligencia empresarial que permite tomar decisiones fundamentadas basadas en los datos.

Reducción de costos a través de capacidades unificadas:

En la actualidad, es común que los sistemas analíticos fusionen productos de diversos proveedores en un solo proyecto. Operando de forma independiente, implica una distribución de capacidad de cómputo en múltiples sistemas. Cuando uno de estos sistemas no se encuentra en uso, su potencial queda inhabilitado, lo que genera un notable desperdicio de recursos.

Fabric simplifica de manera significativa, la adquisición y gestión de recursos, ya que tendrás la posibilidad de adquirir un único conjunto de recursos computacionales, que potencian todas las operaciones, generando una reducción sustancial de costos, dado que cualquier unidad de cómputo sin uso puede ser aprovechada por cualquier otra operación. 


Impulsado por inteligencia artificial:

Gracias a la integración de Copilot (asistente de programación impulsado por inteligencia artificial desarrollado por GitHub), tendrás la capacidad de utilizar el lenguaje conversacional para desarrollar flujos, pipelines de datos, generar código, idear modelos de aprendizaje automático o visualizar los resultados obtenidos. Incluso podrás crear tus propias experiencias de lenguaje conversacional que combinen los modelos de Azure OpenAI Service.


Para conocer más acerca del servicio podrías ingresar al siguiente enlace: 

https://www.microsoft.com/es-es/microsoft-fabric


Entonces, ¿estás preparado para dar el salto? 

Aunque Microsoft Fabric se encuentra en su fase de prelanzamiento, ha sido meticulosamente diseñado para desafiar las convenciones y llevar a su empresa a un nivel completamente nuevo. 

Puedes suscribirte a la evaluación gratuita del servicio, sin necesidad de suministrar información de una tarjeta de crédito, en el siguiente enlace: https://learn.microsoft.com/es-es/fabric/get-started/fabric-trial


A modo de conclusión, Microsoft Fabric puede agregar valor y a la vez estarás listo para afrontar nuevos retos, crear experiencias excepcionales para tus clientes y alcanzar los objetivos en el análisis empresarial que son demandados por tu organización. 

Mediante su uso, los usuarios tendrán la capacidad de emplear un único producto que posee una estructura y experiencia cohesionadas, otorgando todas las competencias esenciales para que los desarrolladores extraigan conocimientos de los datos y los presenten a los interesados comerciales. 

Gracias a su enfoque (SaaS), todos los aspectos se fusionan y ajustan de manera automática, habilitando a los usuarios a registrarse rápidamente y empezar a obtener un valor empresarial tangible en cuestión de minutos. En Bluetab América, an IBM Company, nos encontramos entusiasmados por el potencial de esta nueva solución y estamos preparados con el mejor staff de profesionales, para ser un aliado estratégico en la implementación de este emocionante servicio.

Deygerson Méndez

Data Engineer

¿Quieres saber más de lo que ofrecemos y ver otros casos de éxito?
DESCUBRE BLUETAB

SOLUCIONES, SOMOS EXPERTOS

DATA STRATEGY
DATA FABRIC
AUGMENTED ANALYTICS

Te puede interesar

Introduction to HashiCorp products

August 25, 2020
LEER MÁS

Cómo preparar la certificación AWS Data Analytics – Specialty

November 17, 2021
LEER MÁS

Bank Fraud detection with automatic learning

September 17, 2020
LEER MÁS

De documentos en papel a datos digitales con Fastcapture y Generative AI

June 7, 2023
LEER MÁS

5 common errors in Redshift

December 15, 2020
LEER MÁS

El futuro del Cloud y GenIA en el Next ’23

September 19, 2023
LEER MÁS

Filed Under: Blog, Tech

Azure Data Studio y Copilot

October 11, 2023 by Bluetab

Azure Data Studio y Copilot

Marco LLapapasca

Enterprise Architect

La inteligencia artificial (IA) ha dejado de ser un mero concepto futurista para convertirse en una realidad tangible que está transformando la forma en que las empresas operan y cómo los profesionales tecnológicos desarrollan soluciones. 

Esta revolución no se limita únicamente a la automatización de tareas o a la creación de asistentes virtuales; va más allá, redefiniendo paradigmas y abriendo puertas a posibilidades antes inimaginables.

En el ámbito empresarial, la IA está potenciando la toma de decisiones, optimizando procesos y creando nuevas oportunidades de negocio. Para quienes están al frente del desarrollo tecnológico, representa una herramienta que amplía la creatividad, mejora la eficiencia y redefine los límites de lo que es posible.

Desde la perspectiva de Bluetab, expertos en el manejo y análisis de datos, es evidente que la IA está reconfigurando el panorama de la tecnología de la información. Una muestra clara de esta transformación es la reciente innovación conocida como “Copilot” integrada en Azure Data Studio, una herramienta líder en la administración de bases de datos. 

Esta innovación no solo promete cambiar la forma en que desarrollamos código, sino que también augura un futuro donde la sinergia entre la IA y la gestión de datos desbloqueará potenciales que hoy apenas comenzamos a vislumbrar.

En este contexto, es esencial comprender cómo la inteligencia artificial está moldeando el mundo tecnológico y empresarial, y cómo en empresas como Bluetab estamos al frente de esta revolución, aprovechando las oportunidades y enfrentando los desafíos que presentan, con visión, talento y casos que han sido puesto a prueba.

¿Qué es Copilot?

Copilot es un asistente de programación impulsado por inteligencia artificial desarrollado por GitHub, que fue presentado al público a mediados del 2021. Este asistente ha sido diseñado con un propósito principal: ofrecer sugerencias de código en tiempo real mientras estás desarrollando un programa. Pero, ¿qué es lo interesante? Es que se basa en el contenido previamente escrito para anticiparse a tu próximo paso.

El corazón de Copilot es Codex, un sistema que opera de forma similar a GPT-3. Codex tiene la capacidad de comprender el contexto proporcionado por el código del usuario y, a partir de ello, sintetizar nuevas líneas de código que se alineen con las intenciones del programador.

La conexión con Microsoft

GitHub, la empresa detrás de Copilot, fue adquirida por Microsoft en junio de 2018. No sorprende, entonces, que Copilot haya sido integrado en la suite de aplicaciones Microsoft 365, siendo útil en herramientas como Word, Excel, PowerPoint, Outlook, Teams, entre otras.

Link: https://news.microsoft.com/es-xl/presentamos-microsoft-365-copilot-su-copiloto-para-el-trabajo/

Copilot y Azure Data Studio

El poder de Copilot no se limita a las aplicaciones de ofimática. Como hemos comentado, ahora también ha sido integrado en Azure Data Studio. Esta herramienta es una solución multiplataforma de código abierto que facilita la creación y administración de bases de datos en SQL, T-SQL, sql cmd y PowerShell. Es compatible con Windows, macOS y Linux, haciendo que la herramienta sea extremadamente versátil, ideal tanto para proyectos heredados on premise como para aquellos basados en la nube.

¿Cómo comenzar?

Si estás listo para experimentar esta integración, sigue estos pasos:

  • Instalación de Azure Data Studio:
    Comienza por descargar e instalar Azure Data Studio. Puedes hacerlo directamente desde Link: https://learn.microsoft.com/en-us/sql/azure-data-studio/download-azure-data-studio?view=sql-server-ver16&tabs=redhat-install%2Credhat-uninstall
  • Configura la de conexión.
    Una vez instalado, agregar una nueva conexión SQL. New -> New connection

Como nosotros, vas a realizar una conexión local a Microsoft SQL Server, la cadena de conexión debería lucir así: Server=localhost\SQLEXPRESS01;Database=master;Trusted_Connection=True; 

Finalmente, nos debería quedar de la siguiente forma:

  • Instalación de extensiones:
    Azure Data Studio cuenta con una variedad de extensiones que potencian su funcionalidad. Procede a instalar y configurar la extensión que necesites para tu proyecto. En nuestro caso vamos a utilizar la extensión de:

    GitHub Copilot: Ofrece sugerencias de código en tiempo real. Puedes obtener sugerencias simplemente comenzando a escribir el código que deseas, o incluso escribiendo un comentario en lenguaje natural que describa lo que deseas que haga el código.
  • Configuración de la base de datos Northwind:
    Con Azure Data Studio ya configurado, es el momento perfecto para instalar la base de datos de ejemplo Northwind. Esta base es ideal para familiarizarte con las funcionalidades del programa. Puedes encontrar las instrucciones detalladas para su instalación en Link: https://gist.github.com/jmalarcon/e98d20735d17b3160766c041060d1902

Finalmente, tendremos la base de datos Northwind instalada:

Ahora, vamos a probar Copilot.

  • Definición y prueba de recomendaciones de Copilot:
    Vamos a interpretar y definir el comentario “/* agrupar y mostrar la cantidad de productos por categoría */”. Al hacerlo, pondremos a prueba las sugerencias que Copilot nos ofrece, para evaluar su precisión y relevancia.
  • Generación automática de script:
    Es impresionante observar cómo, con la ayuda de herramientas avanzadas, se nos presenta un script generado automáticamente, manteniendo una sintaxis SQL impecable.
  • Visualización del script generado:
    Tras seguir las recomendaciones y ajustes, así es como luce nuestro script final.
  • Abordando el error de “Invalid object name ‘dbo.categoria'”:
    Al ejecutar nuestro script, nos topamos con un obstáculo: el error “Invalid object name ‘dbo.categoria’.”. Un análisis minucioso de las tablas ‘Categories’ y ‘Products’ revela discrepancias en la nomenclatura. Es esencial asegurarse de que los nombres de las tablas y columnas sean consistentes para evitar este tipo de problemas. 

¿A qué se debe esto?

Las herramientas basadas en inteligencia artificial, como Copilot, necesitan ser correctamente configuradas. En términos más sencillos, debemos “entrenarlas” o, de manera más precisa, proporcionarles la metadata de cada tabla. Al hacerlo, permitimos que la IA tome en cuenta esta información para hacer sugerencias más precisas y coherentes al momento de generar scripts.

La solución es sencilla y directa. Al ejecutar una consulta ‘SELECT’ en cada tabla involucrada, Copilot procederá automáticamente a escanear la tabla y recoger su metadata. Una vez obtenida esta información, la herramienta estará más informada y alineada con la estructura real de nuestra base de datos, permitiéndonos trabajar con mayor precisión y evitando inconvenientes similares en el futuro.

Re-evaluación y recomendaciones ajustadas:
Con las correcciones realizadas, volvemos a probar las recomendaciones. Esta vez, Copilot sugiere un script que considera las columnas correctas, demostrando su capacidad adaptativa

Resultado final:

Con las correcciones implementadas y las recomendaciones ajustadas, obtenemos un resultado final optimizado y preciso.

Estos puntos optimizados ofrecen una narrativa más clara y estructurada, facilitando la comprensión del proceso y los desafíos enfrentados.

La integración de Copilot en Azure Data Studio ha transformado el panorama del desarrollo y administración de bases de datos. Esta herramienta, que promete hacer el trabajo más intuitivo y eficiente, ha demostrado ser un aliado valioso en el ámbito tecnológico. Sin embargo, como toda herramienta, su eficacia radica en cómo se utiliza. A partir de nuestra experiencia en Bluetab, nos gustaría compartir algunas lecciones aprendidas y recomendaciones para maximizar el potencial de Copilot:

  • Verificación de nomenclatura: asegúrese siempre de revisar y validar la nomenclatura de tablas y columnas. Copilot es poderoso, pero también se basa en la consistencia de los datos con los que trabaja.
  • Pruebas continuas: no confíe ciegamente en las recomendaciones automáticas. Siempre es esencial realizar pruebas y validaciones para garantizar que el código generado sea el adecuado para su caso específico.
  • Capacitación continua: aunque Copilot facilita muchas tareas, es vital que los equipos de desarrollo continúen capacitándose y actualizándose en las mejores prácticas de SQL y administración de bases de datos.
  • Feedback activo: al ser una herramienta en constante evolución, proporcionar retroalimentación sobre su experiencia con Copilot puede ayudar a mejorar sus recomendaciones y adaptabilidad en el futuro.


En Bluetab, hemos presenciado y experimentado de primera mano cómo la integración de tecnologías avanzadas como Copilot puede potenciar la productividad de los equipos de desarrollo. Estamos comprometidos con la innovación y con brindar soluciones que estén a la vanguardia tecnológica pero, principalmente, en lograr mayores resultados en un menor tiempo. Esto le permite a nuestros clientes alcanzar retos mas complejos en los tiempos que el mercado lo demanda.

Nuestra misión es llevar estas capacidades y conocimientos al servicio de nuestros clientes, garantizando que puedan aprovechar al máximo las ventajas que la era digital tiene para ofrecer.

Marco LLapapasca

Enterprise Architect

¿Quieres saber más de lo que ofrecemos y ver otros casos de éxito?
DESCUBRE BLUETAB

SOLUCIONES, SOMOS EXPERTOS

DATA STRATEGY
DATA FABRIC
AUGMENTED ANALYTICS

Te puede interesar

We have a Plan B

September 17, 2020
LEER MÁS

Cómo depurar una Lambda de AWS en local

October 8, 2020
LEER MÁS

IBM to acquire Bluetab

July 9, 2021
LEER MÁS

MICROSOFT FABRIC: Una nueva solución de análisis de datos, todo en uno

October 16, 2023
LEER MÁS

Using Large Language Models on Private Information

March 11, 2024
LEER MÁS

Databricks on Azure – An architecture perspective (part 2)

March 24, 2022
LEER MÁS

Filed Under: Blog, Tech

LakeHouse Streaming on AWS with Apache Flink and Hudi (Part 2)

October 4, 2023 by Bluetab

LakeHouse Streaming on AWS with Apache Flink and Hudi (Part 2)

Alberto Jaen

AWS Cloud Engineer

Alfonso Jerez

AWS Cloud Engineer

Adrián Jiménez

AWS Cloud Engineer

Introduction

This article is the second in a series of publications focusing on the creation of a LakeHouse with Hudi from a streaming ingest processed by a Flink application. The first article focuses on laying a good foundation for this platform, where Flink applications were deployed with KDA (Kinesis Data Analytics) for each type of format (MoR, CoW for Hudi and JSON) that write the result of this processing into buckets.

The input data was sent in the previous article from a local machine running a Locust application, which can present problems when scaling and processing a high volume of events. In addition, Kinesis Data Analytics applications with Flink present agility problems in their auto-scaling mode. All these new challenges will be solved in this article.

These tables will also be cataloged in Glue, a service that provides a data catalog in AWS, in order to access them and perform queries of all kinds. The query engine that will consume this metadata will be Athena, which provides a scalable, agile and serverless experience to be able to execute queries with SQL or Spark for our tables hosted in S3.

On the other hand, in this article we have also deployed the necessary components to be able to monitor our applications and thus draw conclusions about the speed at which data is ingested and the possible problems to be solved so that the processing has the required latency according to the requirements imposed.

Finally, a performance and latency comparison of the different Flink applications that write data in Hudi and JSON formats will be made in order to see the different advantages and disadvantages of these formats. 

Architecture

Below you can see the high-level architecture that will be deployed:

For a better understanding we are going to explain it from left to right. As you can see, the most notable change with respect to the first article is the inclusion of a Kubernetes cluster to be able to scale the events that will be sent as input to our streaming application. In this way, it will be possible to thoroughly test the performance of Flink applications depending on their provisioning and especially on the type of format and table in which they write to the LakeHouse. In addition, an ALB (Application Load Balancer) has been made available to access the Locust interface to define the number of users to simulate and how they should scale over time. The URL to access this will appear as output when deploying the infrastructure with Terraform.

On the other hand, significant changes have been made to the Flink KDA applications and the stream they read from. Each application now reads as EFO (Enhanced Fan Out) consumers, so that each of them has a dedicated bandwidth. The reason for this change and its details will be explained in more detail in the dedicated section for Kinesis.

Regarding the monitoring and extraction of metrics in NRT (Near Real Time), lambdas functions have been deployed that query the tables based on Athena thanks to having registered the metadata of these tables in the Glue catalog. It is important to note that the metadata of Hudi tables are registered in Glue by Flink but in the case of JSON a crawler is deployed that registers these tables in the catalog. This crawler must be executed manually for this table to be registered in Glue.

Scaling

Kinesis Stream

Since the goal is to subject the application to a considerable load of events per second, it is necessary to explain how each of the pieces of the architecture can scale according to the volume of data.

As previously mentioned, a Kinesis Stream On-Demand has been chosen to automate the scaling of the shards during load testing. It should be noted that these streams can accommodate a write rate of up to 200% of that specified by the number of shards at any given time.

Once the stream is above 100%, it will automatically increase the number of shards within 15 minutes. The only limitation is therefore not to exceed twice the supported write volume in less than that period.

On the other hand, since you will have three Flink applications reading from the same stream, read limitations will be the biggest problem. A Kinesis Stream only supports 5 GetRecord calls per shard per second. Since each application has to read the entire stream (and therefore all shards), increasing the number of shards does not help to solve this problem.

The solution is to register each application as an Enhanced Fan-Out consumer. This functionality of the Kinesis Stream provides each of these consumers with an individual limit of 5 GetRecord calls and 2MB per shard per second of reading.

This configuration is done on the consumer side, in our case via the Kinesis connector for Flink:

'scan.stream.recordpublisher' = 'EFO',
'scan.stream.efo.registration' = 'EAGER/LAZY',
'scan.stream.efo.consumername' = '{consumer_name}' 

It is worth mentioning that alternatively, it is possible to increase the read latency of our Flink applications. By default Flink performs a read every 200ms per shard, so one application completely consumes the read quota of a stream. By increasing this value to 600ms we could accommodate all three applications, at the cost of increased latency:

scan.shard.getrecords.intervalmillis = '600' 

Use will also be made of the Adaptive Reads option, which dynamically modifies the number of events collected per call depending on the size of each record. This makes it possible to take advantage of the 2 MB/s per shard available for each consumer:

'scan.shard.adaptivereads' = 'true' 

Regarding scaling in Flink KPUs (Kinesis Processing Unit), we have chosen not to make use of autoscaling, since each scaling process incurs in downtime for the application. Due to the different requirements of each of the applications, scaling actions at unexpected times could interrupt load testing. In addition, it is interesting to measure the write performance of each of the applications at equal computing capacity.

Hudi

Timeline

One of the basic systems on which Hudi’s operation and features are based is the timeline. Hudi keeps a temporary record of all the actions that have been performed on the table, as well as the status of this action.

The main actions that make up the timeline are as follows

  • Commits – atomic writing of a set of records to the table in columnar format
  • Delta Commit – similar to commit, represents a write of records in the form of logs to a Merge on Read table.
  • Compaction – compaction of log writes (delta commits) from a MoR table to columnar format
  • Cleans – deletion of old versions of files
  • Rollback – deleted from records written by a failed commit or delta commit
  • Savepoint – marks a set of files as “saved” so that they will not be deleted by the cleanup process. Allows to restore the table to a previous point in the timeline.

Any of these actions can be found in one of three states

  1. Requested – an action has been planned but not yet started
  2. Inflight – the action is in progress
  3. Completed – denotes that the action has been completed.


Table types

As hinted in the operation of the Hudi timeline, there are two types of writing supported: columnar and logs. The columnar (parquet) format constitutes the final form of a Hudi table, together with the timeline metadata. However, it is possible to make use of log writes (avro) to decrease the write latency and eventually compact to columnar format without hindering the write.

The use of these writing methods gives rise to the two types of table that Hudi makes available to us

  • Copy on Write – writes are performed exclusively in columnar format, creating a new file with the new table records. The data is available immediately but incurs higher write latency.
  • Merge on Read – makes use of writing to logs. The new records are initially written as logs, and will later be transformed to columnar format by the compaction process. We obtain lower write latency at the cost of read latency; the new logs will not be available until compaction is performed.


Query Types

In order to take advantage of the characteristics of each type of table, there are three types of queries that can be performed on a Hudi table

  • Snapshot – obtains the latest version of the table. For MoR tables this involves incurring a compaction process to get the latest records in log format. 
  • Read Optimized – for MoR tables, reads only the records already exposed in columnar format without incurring additional read latency.
  • Incremental – collects only new records since a certain commit or compact, facilitating the creation of incremental pipelines. Not supported by Athena

Integration with Glue Catalog

The Hudi connector allows a native integration with the Glue catalog in AWS. Simply add the Hive dependencies in our Flink application:

com.amazonaws.aws-java-sdk-glue
org.apache.hive.hive-common
org.apache.hive.hive-exec 

And specify the catalog configuration in the Hudi connector:

'hive_sync.enable' = 'true',
'hive_sync.db' = '{glue_database}',
'hive_sync.table' = '{table_name}',
'hive_sync.partition_fields' = '{partition_fields}',
'hive_sync.mode' = 'glue',
'hive_sync.use_jdbc' = 'false' 

With this integration, the application will automatically create the tables in the catalog. As mentioned before, there are different types of queries to query a Hudi table. Therefore, different tables will be created in the catalog to support the different queries.

For a CoW table, the table will be queried using a Snapshot query. For MoR on the other hand, two tables will be made available to support Read Optimized or Snapshot queries.

The main application of Glue is to support lambdas so that when executing queries through Athena their execution can be done in a more efficient, fast and secure way:

  • Glue Catalog: centralized storage of information about the organization, design and format of the data, used by Athena to directly perform queries to S3 without having to rely on third parties to obtain this information.
  • Schema Automation: Glue automatically tracks and catalogs data in S3, detecting and adapting schema changes. This avoids possible errors and allows the reading of new fields in case of alterations in the event schemas.

Hudi configuration

It is important to understand the configurations offered by Hudi to optimize our application, in particular for a Near Real Time application it is convenient to be aware of the available options. Although the configuration capacity is immense [1], we will try to summarize the most relevant ones for a first contact with this technology.

Partitioning

Apache Hudi offers the types of partitioning that can be found in other solutions, the main ones will be detailed and the implemented one will be justified:

  • Simple: partitioning based on a single field, in this case the field chosen is ‘ticker’ as it has been identified as the one with the lowest cardinality.
  • Compound Partitioning: partitioning based on multiple fields, it could be interesting to choose a low cardinality field (ticker) and a medium cardinality field (date).
  • Dynamic Partitioning: choice of the variable based on the values, it can be interesting when the cardinality of the variables can undergo variations and an update of the partitioning is required in an automatic and flexible way.


Indexes

Apache Hudi has multiple types of indexing [2], we will briefly discuss the most common ones:

  • Bloom Index – Makes use of a bloom filter on the key of the events, additionally it can be complemented with a filtering by key range. It works well when dealing with a table where most changes occur in the most recent partitions or for event deduplication.
  • Simple: indexing performed by the combination of FileID and RecordKey. Recommended when Upsert operations are not so frequent due to the simplicity it offers.

Both types of indexes can be used in their global form

  • Global index – They impose the uniqueness of the keys in all the partitions of the table, that is to say, they guarantee that there will be only one record with a certain key.
  • Non-global index – Key uniqueness is only required at the partition level. If the data is consistent and a key is only going to exist in one partition, this type of index offers much better performance and better scaling.

In this case, a Bloom Index has been chosen, which is the default in case it is not expressly stated:

"hoodie.index.type" = "BLOOM" 

The choice of this type of indexing is due to the fact that the use cases that have been raised require a considerably high and efficient data processing.

Types of operations

Apache Hudi offers several types of operations [3] that allow users to manage and modify large data sets. The main operations performed in Stress Tests as well as in other scenarios are detailed below:

  • Upsert – This is the default operation, and will execute an insert or an update depending on whether the record already exists after an index lookup. With this operation the table will have no duplicates for its primary key.
  • Insert – This operation ignores the index lookup when inserting events. It is the fastest but the table may contain duplicates. It is still useful if auxiliary deduplication methods are used, or simply the existence of these is tolerable in the use case.
  • Delete: Hudi offers two deletion methods. Soft Delete converts to null the values of the event except for the key. Hard Delete executes a physical deletion of the event in the table.
  • Bulk Insert Operation similar to Insert but optimized for insertion of a large volume of data, at the cost of sacrificing some guarantees in file size control. Scales well for hundreds of TBs in case of initial bootstrap of a large table.

Compaction

In the case of using a MoR table, it is possible to configure the log compaction rate to find the balance between write and read latency that best suits the use case. It is possible to specify a strategy of time or number of delta commits (or both) that execute a compaction process:

compaction.delta_commits
compaction.delta_seconds
compaction.trigger.strategy 

Asynchronous actions

Certain timeline actions such as compacting, cleaning, archiving and clustering can be performed asynchronously by the application, or even relegated to auxiliary processes to the writing application. In the case of Flink, it can help improve write latency and avoid BackPressure problems in the application:

compaction.async.enabled
hoodie.clean.async
hoodie.archive.async
hoodie.clustering.async.enabled 

Stress Tests & Insights

When deploying the applications, different tests have been performed, varying both the maximum load of events and the concurrency and exponential degree of growth of the same. This has been possible thanks to the flexibility offered by Locust being built on a Kubernetes cluster, being able to set a maximum limit of concurrency of events and an incremental of them. In the tests, a maximum limit of 5 to 15K simultaneous users (Peak Concurrency) has been established, scaling the frequency of the same in a linear way, from 5 to 20 more users per second (Spawn Rate):

The different tests have been monitored in order to draw conclusions about the performance, taking into account the specific characteristics of each of the formats. The metrics on which the analyses have been based are both the native CloudWatch Metrics (CPU & Memory Utilization, KPUs, LastCheckpoint SIze & Duration,…), as well as the metrics obtained from the Lambdas that periodically consult the number of events available in the buckets and calculate the average latency of the same.


Number of Events

When analyzing the total number of events processed, which are sent gradually, i.e., as time passes more and more events are sent per second, a fairly similar trend is identified although JSON and Hudi MoR stand out over Hudi CoW in terms of performance. It is worth noting that JSON shows a more stable and steady growth compared to Hudi MoR and CoW and this is because the latter are able to handle incremental updates in the data.

The similarity between JSON and Hudi MoR makes the choice entirely based on the characteristics of the project. In case the data is not updated JSON may be a more interesting solution mainly due to its simplicity, while if there is a high frequency of historical data update, Hudi MoR may be a better solution. This is due both to the higher efficiency in reading tasks and because of the possibility to record different versions of the data.

Latency

Due to the difficulty of standardizing the latency calculation logic between 3 different types of storage, we have chosen to simplify it by calculating it as the difference between the time of event creation and the time of processing in the respective application.


Similar behavior is observed between JSON and Hudi MoR, although the former in a more critical way, having a very low initial latency but as both processing time and load volume increases, this latency is negatively affected.

The choice between JSON and Hudi MoR will depend both on the fault tolerance of the application and the characteristics of each of the formats, in case the data structure is stable and does not change frequently, or does not depend on incremental updates and can deal with complete rewrites, then JSON may be a better choice.

The choice of Hudi CoW over MoR can be made when high error tolerance and high recoverability from failed or corrupted write events are required.


CPU utilization

When analyzing CPU usage, a certain homogeneity has been identified among the different tests, even when working with different workloads. JSON and Hudi MoR stand out for having the lowest CPU usage levels, both for different reasons. JSON stands out for its simplicity by directly including the new data without having to deal with data versioning, while MoR does not consume as much CPU since, due to its characteristics, the highest CPU consumption is made when performing read queries, in the write tasks it only identifies the changes that will be applied when querying them.

Remember that CloudWatch native metrics only allow us to monitor the applications, which correspond to the writing tasks. The monitoring of read tasks corresponds to the Lambdas mentioned above. 

In this case MoR is more beneficial with respect to CoW, since the higher CPU consumption in MoR occurs when querying the stored data while in CoW it occurs when updating the data.

The choice between the most efficient formats depends on the needs of the project, in case a higher fault tolerance, data versioning and higher reading efficiency are required, MoR will be chosen over JSON, between the two Hudi formats, again, the choice will depend on the characteristics of the project, if the queries require heavy and/or complex transformations, MoR would be chosen; if, on the other hand, the project requires greater data integrity and/or the data ingestion is in batch, CoW would be more interesting because when working with these volumes of data, having backup copies, in case of errors, the impact in terms of costs and recovery time is lower.


Memory Utilization

JSON again stands out for having the lowest memory usage values, although for the number of transformations that are performed, they are relatively high, especially considering that it does not have to deal with version management or data merging. These values are due to the fact that it does not have optimized compression capabilities or efficient schema management.

Regarding Hudi, similar conclusions can be drawn as in the CPU usage section, MoR has a higher memory utilization than JSON due to delta log processing and version management and a lower one to CoW since the actual data consolidation does not occur during writing.


Last Checkpoint Size

It is important to highlight, once again, the stability of JSON compared to Hudi applications, since it not only shows a lower value than both in the tests performed, but also a stability that is not achieved with either MoR or CoW, since, as can be seen, when monitoring the size of the Checkpoints, considerable volatility is perceived.

Perceived volatility in Hudi applications is mainly due to Checkpoint failures, which leads to a larger Checkpoint volume after the failure. In addition to this, the volatility in Checkpoint sizes may be related to the optimization and compaction operations performed internally that may lead to state compaction, which considerably reduces the size of the Checkpoint.

Development challenges

Read Throughput of Kinesis and EFO

In order not to exceed the read limit on the Kinesis Stream we have chosen to subscribe the consumers as Enhanced Fan-Out. In some tests in conjunction with Autoscaling this has given problems with the Flink Kinesis connector being unable to close connections when scaling the cluster.

Hudi configuration

Hudi’s configuration has been another sticking point during development. Under high loads the compaction and cleanup processes are more likely to cause backpressure problems and cause application errors. Although configuring these processes to occur asynchronously can alleviate this problem, conflicts and misalignment between processes can arise under high loads. A balance between these configurations and the application’s cluster capacity are key to the smooth operation of the application.

Format heterogeneity

When analyzing the performance of the 3 applications, there is an additional difficulty due to the nature of the format types, which has an impact both on the architecture and on the development of the logics.

The different behavior of the formats in the ingest complicates the development oflogics when calculating latency. MoR writes to logs after compaction, so the data is not immediately available as is the case with CoW or JSON.  This implies that the common measurable metric for all formats is read availability, which is not the main purpose of a MoR table.  

Synchronization with the Glue Catalog

One of the great advantages we have found with Hudi is its ability to synchronize with the Glue catalog, creating the tables and keeping them updated without the need for a crawler. This allows for a cleaner application and architecture than in the case of JSON, for which it must be run manually when deploying applications.

Conclusions

The test results show considerable differences between the JSON, Hudi MoR and CoW formats in terms of efficiency, responsiveness and resource utilization. We proceed to analyze each of the aspects in more detail:

  • Processing Efficiency: JSON and Hudi MoR stand out in most metrics, showing optimal performance in terms of Latency, CPU & Memory Utilization. However, JSON behavior is more stable and predictable, although MoR has advantages over JSON, for example, in incremental update management.
  • Resilience and Fault Tolerance: fault tolerance is a very important factor in the decision on the choice between Hudi and JSON. In the case of MoR and CoW, it will depend on the degree of criticality, since at a general level the performance in writing tasks for MoR is superior.
  • Resource Usage: JSON is shown to be the most lightweight, with low CPU and memory utilization, due to its inherent simplicity. Whereas Hudi MoR and CoW, due to the nature of their design and data management, require more resources, especially in operations involving version management and data compaction.

Finally, it is interesting to identify in which use cases or projects each of the formats may be more recommendable depending on their characteristics and the network flags that may be established:

  • JSON: Recommended for applications with stable data structures that do not require incremental updates and where simplicity and stability are key.
  • Hudi MoR: Suitable for projects that require efficient management of incremental updates and where latency and writing efficiency are crucial.
  • Hudi CoW: Ideal for contexts where data integrity is essential, and robust error recovery is needed, especially in batch ingest scenarios. 

References

[1] Hudi Tables Configuration. [link]

[2] Index Types in Hudi. [link]

[3] Hudi Operation Types. [link]

Autores

Alberto Jaen

AWS Cloud Engineer

I started my career with the development, maintenance and administration of multidimensional databases and Data Lakes. From there I started to be interested in data platforms and cloud architectures, being certified 3 times in AWS and 2 with Hashicorp.

I am currently working as a Cloud Engineer developing Data Lakes and DataWarehouses with AWS for a client related to the organization of sporting events worldwide.

Alfonso Jerez

AWS Cloud Engineer

Passionate about data and new technologies, specialized as AWS Cloud Engineer in DataWarehouses optimization and Data Lakes ingestion and transformation processes. Motivated by continuous improvement and automation of service integration.

Actively collaborating with the Cloud Practice group in research and blog development of cutting-edge and innovative technologies such as this one, thus fostering continuous learning.

Adrián Jiménez

AWS Cloud Engineer

Dedicated to constantly learning new technologies and their application, enjoying using them to solve technological challenges. I develop my career as a Cloud Engineer designing, implementing and maintaining infrastructure in AWS.

I actively collaborate in the Cloud Practice, where we research and experiment with new technologies, seeking solutions to the challenges faced by our clients.

Navigation

¿Quieres saber más de lo que ofrecemos y ver otros casos de éxito?
DESCUBRE BLUETAB

SOLUCIONES, SOMOS EXPERTOS

DATA STRATEGY
DATA FABRIC
AUGMENTED ANALYTICS

Te puede interesar

Snowflake Advanced Storage Guide

October 3, 2022
LEER MÁS

Mi experiencia en el mundo de Big Data – Parte I

October 14, 2021
LEER MÁS

Bank Fraud detection with automatic learning II

September 17, 2020
LEER MÁS

Big Data and loT

February 10, 2021
LEER MÁS

Databricks on Azure – An Architecture Perspective (part 1)

February 15, 2022
LEER MÁS

Leadership changes at Bluetab EMEA

April 3, 2024
LEER MÁS

Filed Under: Outstanding, Practices, Tech

  • « Go to Previous Page
  • Page 1
  • Page 2
  • Page 3
  • Page 4
  • Interim pages omitted …
  • Page 18
  • Go to Next Page »

Footer

LegalPrivacy Cookies policy

Patron

Sponsor

© 2025 Bluetab Solutions Group, SL. All rights reserved.