Bluetab

by Bluetab
We are delighted that IBM has announced its intent to acquire Bluetab to enhance its portfolio of Data and AI Services. The deal is subject to standard closing and regulatory conditions. For more information, see press release here
This deal will provide Bluetab with a growth platform for both our customers and for
our 700+ employees. Belonging to a large group like IBM will allow us to generate new and more exciting opportunities whilst maintaining the strong engineering culture that has allowed us to attract the best technical talent and become a leader in the market segments of Data Solutions and AI.
The operation is expected to close during the third quarter of 2021.
SOLUTIONS, WE ARE EXPERTS
You may be interested in


by Bluetab

AWS Cloud Architect

LitmusChaos nace con el objetivo de ayudar a desarrolladores y SREs (Site Reliability Engineering ) de Kubernetes a identificar puntos débiles y mejorar la resiliencia de sus aplicaciones/plataformas proporcionando un marco de trabajo completo.
Sus principales ventajas respecto a otras herramientas son:
El producto está liberado bajo licencia Apache-2.0, dispone de una amplia comunidad de desarrolladores y desde 2020 pertenece a Cloud Native Computing Foundation.
Recomendamos abrir una consola y crear 4 paneles:

git clone https://github.com/angelmaroco/litmus-chaos-engineering-workshop.git
cd litmus-chaos-engineering-workshop Para este workshop vamos a utilizar minikube pero Litmus puede ser desplegado en cualquier servicio gestionado tipo EKS/AKS/GKE.
Minikube requiere de un gestor de contenedores o máquinas virtuales (Docker, Hyperkit, Hyper-V, KVM, Parallels, Podman, VirtualBox, or VMWare).
Recomendamos hacer uso de docker. En el caso de no estar disponible en el sistema, puedes realizar la instalación con los siguientes comandos:
if ! [ -x "$(command -v docker)" ]; then
    curl -fsSL https://get.docker.com -o /tmp/get-docker.sh
    sh /tmp/get-docker.sh
fi
# install kubectl
curl -Ls "https://dl.k8s.io/release/$(curl -L -s https://dl.k8s.io/release/stable.txt)/bin/linux/amd64/kubectl" --output /tmp/kubectl
sudo install /tmp/kubectl /usr/local/bin/kubectl
kubectl version --client
# install minikube
curl -Ls https://storage.googleapis.com/minikube/releases/latest/minikube-linux-amd64 --output /tmp/minikube-linux-amd64
sudo install /tmp/minikube-linux-amd64 /usr/local/bin/minikube
minikube version
# starting minikube
minikube start --cpus 2 --memory 4096
# enabled ingress & metrics servers
minikube addons enable ingress
minikube addons enable metrics-server
# enabled tunnel & dashboard
minikube tunnel > /dev/null &
minikube dashboard > /dev/null &
# create namespace testing
kubectl apply -f src/base/testing-ns.yaml

# create namespace litmus
kubectl apply -f src/base/litmus-ns.yaml

# create namespace monitoring (prometheus + grafana)
kubectl apply -f src/base/monitoring-ns.yaml

TESTING_NAMESPACE="testing"
LITMUS_NAMESPACE="litmus"
MONITORING_NAMESPACE="monitoring"
Desplegamos una aplicación de test para poder ejecutar los experimentos de litmus.
# deployment
kubectl apply -f src/nginx/nginx-deployment.yaml --namespace="${TESTING_NAMESPACE}"

# enable hpa
kubectl apply -f src/nginx/nginx-hpa.yaml --namespace="${TESTING_NAMESPACE}"

# expose service
kubectl expose deployment app-sample --type=LoadBalancer --port=80  -n "${TESTING_NAMESPACE}"

# wait deployment
kubectl wait --for=condition=available --timeout=60s deployment/app-sample -n "${TESTING_NAMESPACE}"

# get pods
kubectl get pods -n "${TESTING_NAMESPACE}"

#-----------------------------------------

NAME                          READY   STATUS    RESTARTS   AGE
app-sample-7ff489dbd5-82ppw   1/1     Running   0          45m
app-sample-7ff489dbd5-jg9vh   1/1     Running   0          45m

# get service
kubectl get services -n "${TESTING_NAMESPACE}"

# -----------------------------------------

NAME         TYPE           CLUSTER-IP       EXTERNAL-IP      PORT(S)        AGE
app-sample   LoadBalancer   10.109.196.239   10.109.196.239   80:30020/TCP   3m54s
TESTING_NAMESPACE='testing'
URL_SERVICE=$(minikube service app-sample --url -n "${TESTING_NAMESPACE}")
while true; do sleep 5; curl --connect-timeout 2 -s -o /dev/null -w "Response code %{http_code}"  ${URL_SERVICE}; echo -e ' - '$(date);done
TESTING_NAMESPACE='testing'
watch -n 1 kubectl get pods -n "${TESTING_NAMESPACE}"
kubectl get events -A -w # litmus operator & experiments
kubectl apply -f https://litmuschaos.github.io/litmus/litmus-operator-v1.13.0.yaml -n "${LITMUS_NAMESPACE}"
kubectl apply -f https://hub.litmuschaos.io/api/chaos/1.13.0\?file\=charts/generic/experiments.yaml -n "${TESTING_NAMESPACE}"
kubectl get chaosexperiments -n "${TESTING_NAMESPACE}"

# ----------------------------------------------------

NAME                      AGE
container-kill            6s
disk-fill                 6s
disk-loss                 6s
docker-service-kill       6s
k8-pod-delete             6s
k8-service-kill           6s
kubelet-service-kill      6s
node-cpu-hog              6s
node-drain                6s
node-io-stress            6s
node-memory-hog           6s
node-poweroff             6s
node-restart              6s
node-taint                6s
pod-autoscaler            6s
pod-cpu-hog               6s
pod-delete                6s
pod-io-stress             6s
pod-memory-hog            6s
pod-network-corruption    6s
pod-network-duplication   6s
pod-network-latency       6s
pod-network-loss          6s
Litmus permite exportar las métricas de los experimentos a Prometheus a través de chaos-exporter.
kubectl -n ${MONITORING_NAMESPACE} apply -f src/litmus/monitoring/utils/prometheus/prometheus-operator/

kubectl -n ${MONITORING_NAMESPACE} apply -f src/litmus/monitoring/utils/metrics-exporters-with-service-monitors/kube-state-metrics/

kubectl -n ${MONITORING_NAMESPACE} apply -f src/litmus/monitoring/utils/alert-manager-with-service-monitor/

kubectl -n ${LITMUS_NAMESPACE} apply -f src/litmus/monitoring/utils/metrics-exporters-with-service-monitors/litmus-metrics/chaos-exporter/

kubectl -n ${MONITORING_NAMESPACE} apply -f src/litmus/monitoring/utils/prometheus/prometheus-configuration/

kubectl -n ${MONITORING_NAMESPACE} apply -f src/litmus/monitoring/utils/grafana/

kubectl -n ${MONITORING_NAMESPACE} apply -f src/litmus/monitoring/utils/metrics-exporters-with-service-monitors/node-exporter/

# wait deployment
kubectl wait --for=condition=available --timeout=60s deployment/grafana -n ${MONITORING_NAMESPACE}
kubectl wait --for=condition=available --timeout=60s deployment/prometheus-operator -n ${MONITORING_NAMESPACE}

echo "Acceso dashboard --> $(minikube service grafana -n ${MONITORING_NAMESPACE} --url)/d/nodepodmetrics/node-and-pod-chaos-metrics?orgId=1&refresh=5s"
Para este workshop hemos personalizado un dashboard de grafana donde visualizaremos:
Datos acceso grafana:

Para habilitar la ejecución de experimentos contra nuestro deployment, necesitamos añadir la anotación litmuschaos.io/chaos=“true“. Como veremos más adelante, todos los experimentos tienen la propiedad annotationCheck: “true”.
# add annotate (enable chaos)
kubectl annotate deploy/app-sample litmuschaos.io/chaos="true" -n "${TESTING_NAMESPACE}"
kubectl describe deploy/app-sample -n "${TESTING_NAMESPACE}"

# -----------------------------------------------------------

Name:                   app-sample
Namespace:              testing
CreationTimestamp:      Mon, 29 Mar 2021 09:35:53 +0200
Labels:                 app=app-sample
                        app.kubernetes.io/name=app-sample
Annotations:            deployment.kubernetes.io/revision: 1
                        litmuschaos.io/chaos: true # <-- HABILITAMOS EXPERIMENTOS
Selector:               app.kubernetes.io/name=app-sample
Replicas:               2 desired | 2 updated | 2 total | 2 available | 0 unavailable
StrategyType:           RollingUpdate
Cada experimento debe tener asociado un ServiceAccount, un Role para definir permisos y un RoleBinding para relacionar el ServiceAccount/Role.
Podéis encontrar todas las definiciones dentro de src/litmus/nombre-experimento/nombre-experimento-sa.yaml
apiVersion: v1
kind: ServiceAccount
metadata:
  name: container-kill-sa
  namespace: testing
  labels:
    name: container-kill-sa
    app.kubernetes.io/part-of: litmus
---
apiVersion: rbac.authorization.k8s.io/v1
kind: Role
metadata:
  name: container-kill-sa
  namespace: testing
  labels:
    name: container-kill-sa
    app.kubernetes.io/part-of: litmus
rules:
  - apiGroups: [""]
    resources:
      ["pods", "pods/exec", "pods/log", "events", "replicationcontrollers"]
    verbs:
      ["create", "list", "get", "patch", "update", "delete", "deletecollection"]
  - apiGroups: ["batch"]
    resources: ["jobs"]
    verbs: ["create", "list", "get", "delete", "deletecollection"]
  - apiGroups: ["apps"]
    resources: ["deployments", "statefulsets", "daemonsets", "replicasets"]
    verbs: ["list", "get"]
  - apiGroups: ["apps.openshift.io"]
    resources: ["deploymentconfigs"]
    verbs: ["list", "get"]
  - apiGroups: ["argoproj.io"]
    resources: ["rollouts"]
    verbs: ["list", "get"]
  - apiGroups: ["litmuschaos.io"]
    resources: ["chaosengines", "chaosexperiments", "chaosresults"]
    verbs: ["create", "list", "get", "patch", "update"]
---
apiVersion: rbac.authorization.k8s.io/v1
kind: RoleBinding
metadata:
  name: container-kill-sa
  namespace: testing
  labels:
    name: container-kill-sa
    app.kubernetes.io/part-of: litmus
roleRef:
  apiGroup: rbac.authorization.k8s.io
  kind: Role
  name: container-kill-sa
subjects:
  - kind: ServiceAccount
    name: container-kill-sa
namespace: testing Para facilitar la comprensión, hemos dividido en 3 secciones el contenido de un experimento. Podéis encontrar todas las definiciones dentro de src/litmus/nombre-experimento/chaos-engine-.yaml
En esta sección especificaremos atributos comunes a todos los experimentos. Para este workshop, debido a que estamos realizando los experimentos contra un único deployment, el único atributo que cambiará entre experimentos es “chaosServiceAccount”.
apiVersion: litmuschaos.io/v1alpha1
kind: ChaosEngine
metadata:
  name: app-sample-chaos # Nombre del chaos-engine
  namespace: testing     # Namespace de testing
spec:
  annotationCheck: "true" # Hemos creado una anotación en nuestro deployment app-sample. Con la propiedad marcada a "true" indicamos que aplicarmeos el experimento a este despliegue.

  engineState: "active"   # Activación/desactivación de experimento

  appinfo:                # En esta sección proporcionamos la información de nuestro deployment.
    appns: "testing"      # Namespace donde se localiza
    applabel: "app.kubernetes.io/name=app-sample" # Etiqueta asociada a nuestro deployment
    appkind: "deployment" # Tipo de recurso (sólo admite deployment, lo que afectará a todos los pods)

  chaosServiceAccount: container-kill-sa # Nombre del service account (creado en el paso anterior)
  monitoring: true       # si queremos activar la monitorización (prometheus o similares)
  jobCleanUpPolicy: "delete" # Permite controlar la limpieza de recursos tras la ejecución. Especificar "retain" para debug.
En esta sección definiremos las variables de entorno propias de cada experimento. Las variables “CHAOS_INTERVAL” y “TOTAL_CHAOS_DURATION” son comunes a todos los experimentos.
  experiments:
    - name: container-kill # Nombre del experimento
      spec:
        components:
          env:
            # Intervalo (segundos) por cada iteración
            - name: CHAOS_INTERVAL
              value: "10"

            # Tiempo total (segundos) que durará el experimento
            - name: TOTAL_CHAOS_DURATION
              value: "60"
En esta sección se informan los atributos para las pruebas de validación. El resultado del experimento dependerá del cumplimiento de la validación especificada.
En el siguiente enlace podeis consultar los tipos de pruebas disponibles.
        probe:
          - name: "check-frontend-access-url" # Nombre de prueba
            type: "httpProbe"                 # Petición de tipo HTTP(S). Alternativas: cmdProbe, k8sProbe, promProbe.
            httpProbe/inputs:
              url: "http://app-sample.testing.svc.cluster.local" # URL a validar
              insecureSkipVerify: false                               # Permitir HTTP sin TLS
              method:
                get:                          # Petición tipo GET
                  criteria: ==                # Criterio a evaluar
                  responseCode: "200"         # Respuesta a evaluar
            mode: "Continuous"                # La prueba se ejecuta de forma continua (alternativas: SoT, EoT, Edge, OnChaos)
            runProperties:
              probeTimeout: 5                 # Número de segundos para timeout en la petición
              interval: 5                     # Intervalo (segundos) entre re-intentos
              retry: 1                        # Número de re-intento antes de dar por fallida la validación
              probePollingInterval: 2         # Intervalo (segundos) entre peticiones
Una de las principales ventajas de litmus es poder definir los experimentos de forma declarativa, lo que nos permite incluir fácilmente nuestros gestores de plantillas. Recomendamos el uso de kustomize.
Descripción: Aborta la ejecución del servicio docker dentro de un pod. La selección del pod es aleatoria.
Información oficial del experimento: enlace
Criterio de entrada: 2 pods de app-sample en estado “Running”
kubectl get pods -n "${TESTING_NAMESPACE}" kubectl get pods -n "${TESTING_NAMESPACE}"
# -----------------------------------------
NAME READY STATUS RESTARTS AGE
app-sample-7ff489dbd5-82ppw 1/1 Running 0 9h
app-sample-7ff489dbd5-jg9vh 1/1 Running 0 9h
experiments:
    - name: container-kill
    spec:
        components:
        env:
            # provide the chaos interval
            - name: CHAOS_INTERVAL
            value: "10"

            # provide the total chaos duration
            - name: TOTAL_CHAOS_DURATION
            value: "20"

            - name: CONTAINER_RUNTIME
            value: "docker"

            - name: SOCKET_PATH
            value: "/var/run/docker.sock"
Hipótesis: Tenemos dos pods escuchando por el 80 tras un balanceador. Nuestro deployment tiene readinessProbe con periodSeconds=1 y failureThreshold=1. Si uno de los pods deja de responder, el balanceador deja de enviar tráfico a ese pod y debe responder el otro. Hemos establecido el healthcheck del experimento cada 5s (tiempo máximo de respuesta aceptable) atacando directamente contra el balanceador, por lo que no deberíamos de tener pérdida de servicio en ningún momento.
Creación de SA, Role y RoleBinding
kubectl apply -f src/litmus/kill-container/kill-container-sa.yaml -n "${TESTING_NAMESPACE}"
Ejecución de experimento
kubectl apply -f src/litmus/kill-container/chaos-engine-kill-container.yaml  -n "${TESTING_NAMESPACE}"

# Awaited -> Pass/Fail
watch -n 1 kubectl get chaosresult app-sample-chaos-container-kill -n "${TESTING_NAMESPACE}" -o jsonpath="{.status.experimentstatus.verdict}"
Observaciones: durante el experimento observamos 2 reinicios de pod con transición “Running” -> “Error” -> “Running”.
Validación: Peticiones get al balanceador con respuesta 200.
probe:
- name: "check-frontend-access-url"
    type: "httpProbe"
    httpProbe/inputs:
    url: "http://app-sample.testing.svc.cluster.local"
    insecureSkipVerify: false
    method:
        get:
        criteria: ==
        responseCode: "200"
    mode: "Continuous"
    runProperties:
    probeTimeout: 5
    interval: 5
    retry: 1
    probePollingInterval: 2
$ kubectl describe chaosresult app-sample-chaos-container-kill -n "${TESTING_NAMESPACE}"

# --------------------------------------------------------------------------------------

Spec:
    Engine:      app-sample-chaos
    Experiment:  container-kill
Status:
    Experimentstatus:
        Fail Step:                 N/A
        Phase:                     Completed
        Probe Success Percentage:  100
        Verdict:                   Pass
History:
    Failed Runs:   0
    Passed Runs:   6
    Stopped Runs:  0
Probe Status:
    Name:  check-frontend-access-url
    Status:
        Continuous:  Passed 👍
    Type:            httpProbe
Events:
    Type    Reason   Age    From                         Message
    ----    ------   ----   ----                         -------
    Normal  Awaited  4m48s  container-kill-5i56m6-4pkxg  experiment: container-kill, Result: Awaited
    Normal  Pass     4m4s   container-kill-5i56m6-4pkxg  experiment: container-kill, Result: Pass


$ kubectl get pods -n testing

NAME                          READY   STATUS    RESTARTS   AGE
app-sample-6c48f8c4cc-74lvl   1/1     Running   2          25m
app-sample-6c48f8c4cc-msdmj   1/1     Running   0          25m

Descripción: permite escalar las réplicas para testear el autoescalado en el nodo.
Información oficial del experimento: enlace
Criterio de entrada: 2 pods de app-sample en estado “Running”
  $ kubectl get pods -n "${TESTING_NAMESPACE}"

  # ------------------------------------------

  NAME                          READY   STATUS    RESTARTS   AGE
  app-sample-6c48f8c4cc-74lvl   1/1     Running   2          29m
  app-sample-6c48f8c4cc-msdmj   1/1     Running   0          28m
Parámetros de entrada experimento:
experiments:
  - name: pod-autoscaler
    spec:
      components:
        env:
          # set chaos duration (in sec) as desired
          - name: TOTAL_CHAOS_DURATION
            value: "60"

          # number of replicas to scale
          - name: REPLICA_COUNT
            value: "10"
Hipótesis: Disponemos de un HPA con min = 2 y max = 10. Con la ejecución de este experimento queremos validar que nuestro nodo es capaz de escalar a 10 réplicas (el max. establecido en el HPA). Cuando ejecutemos el experimento, se crearán 10 réplicas y en ningún momento tendremos pérdida de servicio. Nuestro HPA tiene establecido el parámetro “–horizontal-pod-autoscaler-downscale-stabilization” a 300s, por lo que durante ese intervalo tendremos 10 réplicas en estado “Running” y transcurrido ese intervalo, volveremos a tener 2 réplicas.
Creación de SA, Role y RoleBinding
$ kubectl apply -f src/litmus/pod-autoscaler/pod-autoscaler-sa.yaml -n "${TESTING_NAMESPACE}"
$ kubectl apply -f src/litmus/pod-autoscaler/chaos-engine-pod-autoscaler.yaml -n "${TESTING_NAMESPACE}"
Observaciones:
Validación: Peticiones get al balanceador con respuesta 200.
probe:
- name: "check-frontend-access-url"
    type: "httpProbe"
    httpProbe/inputs:
    url: "http://app-sample.testing.svc.cluster.local"
    insecureSkipVerify: false
    method:
        get:
        criteria: ==
        responseCode: "200"
    mode: "Continuous"
    runProperties:
    probeTimeout: 5
    interval: 5
    retry: 1
    probePollingInterval: 2
$ kubectl describe chaosresult app-sample-chaos-pod-autoscaler  -n "${TESTING_NAMESPACE}"

# ----------------------------------------------------------------------------------------

Spec:
    Engine:      app-sample-chaos
    Experiment:  pod-autoscaler
Status:
    Experimentstatus:
        Fail Step:                 N/A
        Phase:                     Completed
        Probe Success Percentage:  100
        Verdict:                   Pass
History:
    Failed Runs:   0
    Passed Runs:   6
    Stopped Runs:  0
Probe Status:
    Name:  check-frontend-access-url
    Status:
        Continuous:  Passed 👍
    Type:            httpProbe
Events:
    Type    Reason   Age    From                         Message
    ----    ------   ----   ----                         -------
    Normal  Awaited  4m46s  pod-autoscaler-95wa6x-858jv  experiment: pod-autoscaler, Result: Awaited
    Normal  Pass     3m32s  pod-autoscaler-95wa6x-858jv  experiment: pod-autoscaler, Result: Pass

$ kubectl get pods -n testing

# ---------------------------

NAME                          READY   STATUS        RESTARTS   AGE
app-sample-6c48f8c4cc-5kzpg   0/1     Completed     0          39s
app-sample-6c48f8c4cc-74lvl   0/1     Running       2          32m
app-sample-6c48f8c4cc-bflws   0/1     Completed     0          39s
app-sample-6c48f8c4cc-c5ls8   0/1     Completed     0          39s
app-sample-6c48f8c4cc-d9zj4   0/1     Completed     0          39s
app-sample-6c48f8c4cc-f2xnt   0/1     Completed     0          39s
app-sample-6c48f8c4cc-f7qdl   0/1     Completed     0          39s
app-sample-6c48f8c4cc-ff84v   0/1     Completed     0          39s
app-sample-6c48f8c4cc-k29rr   0/1     Completed     0          39s
app-sample-6c48f8c4cc-l5fqp   0/1     Completed     0          39s
app-sample-6c48f8c4cc-m587t   0/1     Completed     0          39s
app-sample-6c48f8c4cc-msdmj   1/1     Running       0          32m
app-sample-6c48f8c4cc-n5h6l   0/1     Completed     0          39s
app-sample-6c48f8c4cc-qr5nd   0/1     Completed     0          39s
app-sample-chaos-runner       0/1     Completed     0          47s
pod-autoscaler-95wa6x-858jv   0/1     Completed     0          45s

Descripción: permite consumir recursos de CPU dentro de POD
Información oficial del experimento: enlace
Criterio de entrada: 2 pods de app-sample en estado “Running”
  kubectl get pods -n "${TESTING_NAMESPACE}"

  # ---------------------------------------

  NAME                          READY   STATUS    RESTARTS   AGE
  app-sample-6c48f8c4cc-74lvl   1/1     Running   2          52m
  app-sample-6c48f8c4cc-msdmj   1/1     Running   0          52m
experiments:
  - name: pod-cpu-hog
    spec:
      components:
        env:
          #number of cpu cores to be consumed
          #verify the resources the app has been launched with
          - name: CPU_CORES
            value: "1"

          - name: TOTAL_CHAOS_DURATION
            value: "60" # in seconds

          - name: PODS_AFFECTED_PERC
            value: "0"
Hipótesis: Disponemos de un HPA con min = 2 y max = 10. Con la ejecución de este experimento queremos validar que nuestro HPA funciona correctamente. Tenemos establecido un targetCPUUtilizationPercentage=50%, lo que quiere decir que si inyectamos consumo de CPU en un pod, el HPA debe establecer el número de réplicas a 3 (2 min + 1 autoscaler). En ningún momento debemos tener pérdida de servicio. Nuestro HPA tiene establecido el parámetro “–horizontal-pod-autoscaler-downscale-stabilization” a 300s, por lo que durante ese intervalo tendremos 10 réplicas en estado “Running” y transcurrido ese intervalo, volveremos a tener 2 réplicas.
Creación de SA, Role y RoleBinding
kubectl apply -f src/litmus/pod-cpu-hog/pod-cpu-hog-sa.yaml -n "${TESTING_NAMESPACE}"
Ejecución de experimento
kubectl apply -f src/litmus/pod-cpu-hog/chaos-engine-pod-cpu-hog.yaml -n "${TESTING_NAMESPACE}"
Observaciones: durante el experimento vemos 2 pods en estado “Runnning”. Se comienza a inyectar consumo en uno de los POD y se autoescala a 3 réplicas. A los 300s se vuelve a tener 2 réplicas.
Validación: Peticiones get al balanceador con respuesta 200.
probe:
- name: "check-frontend-access-url"
    type: "httpProbe"
    httpProbe/inputs:
    url: "http://app-sample.testing.svc.cluster.local"
    insecureSkipVerify: false
    method:
        get:
        criteria: ==
        responseCode: "200"
    mode: "Continuous"
    runProperties:
    probeTimeout: 5
    interval: 5
    retry: 1
    probePollingInterval: 2
Resultado: resultado “Pass” (tres pods en estado “Running”, sin pérdida de servicio durante la duración del experimento)
$ kubectl describe chaosresult app-sample-chaos-pod-cpu-hog -n "${TESTING_NAMESPACE}"

# -----------------------------------------------------------------------------------

Spec:
    Engine:      app-sample-chaos
    Experiment:  pod-cpu-hog
Status:
    Experimentstatus:
        Fail Step:                 N/A
        Phase:                     Completed
        Probe Success Percentage:  100
        Verdict:                   Pass
History:
    Failed Runs:   0
    Passed Runs:   6
    Stopped Runs:  0
Probe Status:
    Name:  check-frontend-access-url
    Status:
        Continuous:  Passed 👍
    Type:            httpProbe
Events:
    Type    Reason   Age    From                         Message
    ----    ------   ----   ----                         -------
    Normal  Awaited  2m23s  pod-cpu-hog-mpen59-zcpr6  experiment: pod-cpu-hog, Result: Awaited
    Normal  Pass     74s    pod-cpu-hog-mpen59-zcpr6  experiment: pod-cpu-hog, Result: Pass

$ kubectl get pods -n testing

  NAME                          READY   STATUS      RESTARTS   AGE
  app-sample-6c48f8c4cc-74lvl   1/1     Running     6          46m
  app-sample-6c48f8c4cc-msdmj   1/1     Running     0          46m
  app-sample-5c5575cdb7-hq5gs   1/1     Running     0          49s
  app-sample-chaos-runner       0/1     Completed   0          104s
  pod-cpu-hog-mpen59-zcpr6      0/1     Completed   0          103s

pod-network-loss
kubectl apply -f src/litmus/pod-network-loss/pod-network-loss-sa.yaml -n "${TESTING_NAMESPACE}"

kubectl apply -f src/litmus/pod-network-loss/chaos-engine-pod-network-loss.yaml  -n "${TESTING_NAMESPACE}"

kubectl describe chaosresult app-sample-chaos-pod-network-loss -n "${TESTING_NAMESPACE}"
kubectl apply -f src/litmus/pod-memory/pod-memory-hog-sa.yaml -n "${TESTING_NAMESPACE}"

kubectl apply -f src/litmus/pod-memory/chaos-engine-pod-memory-hog.yaml  -n "${TESTING_NAMESPACE}"

kubectl describe chaosresult app-sample-chaos-pod-memory-hog -n "${TESTING_NAMESPACE}"
kubectl apply -f src/litmus/pod-delete/pod-delete-sa.yaml -n "${TESTING_NAMESPACE}"

kubectl apply -f src/litmus/pod-delete/chaos-engine-pod-delete.yaml -n "${TESTING_NAMESPACE}"

kubectl describe chaosresult app-sample-chaos-pod-delete -n "${TESTING_NAMESPACE}"
Litmus soporta el uso de planificaciones de experimentos. Dispone de las siguientes opciones:
apiVersion: litmuschaos.io/v1alpha1
kind: ChaosSchedule
metadata:
  name: schedule-nginx
spec:
  schedule:
    now: true
  engineTemplateSpec:
    appinfo:
      appns: testing
      applabel: app.kubernetes.io/name=app-sample
      appkind: deployment
    annotationCheck: 'true'
apiVersion: litmuschaos.io/v1alpha1
kind: ChaosSchedule
metadata:
  name: schedule-nginx
spec:
  schedule:
    once:
      #should be modified according to current UTC Time
      executionTime: "2020-05-12T05:47:00Z"
  engineTemplateSpec:
    appinfo:
      appns: testing
      applabel: app.kubernetes.io/name=app-sample
      appkind: deployment
    annotationCheck: 'true'
apiVersion: litmuschaos.io/v1alpha1
kind: ChaosSchedule
metadata:
  name: schedule-nginx
spec:
  schedule:
    repeat:
      properties:
         #format should be like "10m" or "2h" accordingly for minutes or hours
        minChaosInterval: "2m"
  engineTemplateSpec:
    appinfo:
      appns: testing
      applabel: app.kubernetes.io/name=app-sample
      appkind: deployment
    annotationCheck: 'true'
apiVersion: litmuschaos.io/v1alpha1
kind: ChaosSchedule
metadata:
  name: schedule-nginx
spec:
  schedule:
    repeat:
      timeRange:
        #should be modified according to current UTC Time
        startTime: "2020-05-12T05:47:00Z"
        endTime: "2020-09-13T02:58:00Z"
      properties:
        #format should be like "10m" or "2h" accordingly for minutes and hours
        minChaosInterval: "2m"
  engineTemplateSpec:
    appinfo:
      appns: testing
      applabel: app.kubernetes.io/name=app-sample
      appkind: deployment
    annotationCheck: 'true'
apiVersion: litmuschaos.io/v1alpha1
kind: ChaosSchedule
metadata:
  name: schedule-nginx
spec:
  schedule:
    repeat:
      timeRange:
        #should be modified according to current UTC Time
        startTime: "2020-05-12T05:47:00Z"
      properties:
         #format should be like "10m" or "2h" accordingly for minutes and hours
        minChaosInterval: "2m"
  engineTemplateSpec:
    appinfo:
      appns: testing
      applabel: app.kubernetes.io/name=app-sample
      appkind: deployment
    annotationCheck: 'true'
apiVersion: litmuschaos.io/v1alpha1
kind: ChaosSchedule
metadata:
  name: schedule-nginx
spec:
  schedule:
    repeat:
      properties:
        #format should be like "10m" or "2h" accordingly for minutes and hours
        minChaosInterval: "2m"
      workHours:
        # format should be <starting-hour-number>-<ending-hour-number>(inclusive)
        includedHours: 0-12
  engineTemplateSpec:
    appinfo:
      appns: testing
      applabel: app.kubernetes.io/name=app-sample
      appkind: deployment
    annotationCheck: 'true'
apiVersion: litmuschaos.io/v1alpha1
kind: ChaosSchedule
metadata:
  name: schedule-nginx
spec:
  schedule:
    repeat:
      properties:
        #format should be like "10m" or "2h" accordingly for minutes and hours
        minChaosInterval: "2m"
      workDays:
        includedDays: "Mon,Tue,Wed,Sat,Sun"
  engineTemplateSpec:
    appinfo:
      appns: testing
      applabel: app.kubernetes.io/name=app-sample
      appkind: deployment
    annotationCheck: 'true'
Hasta el momento hemos realizado pruebas para validar cómo se comporta nuestro nodo de k8s bajo escenarios ideales, sin carga en el sistema por parte de los usuarios finales de la aplicación.
Por lo general, tendremos definidos SLIs/SLOs/SLAs los cuales hay que garantizar que cumplimos bajo cualquier eventualidad y para ello debemos de disponer de las herramientas adecuadas. En este caso, Litmus + Apache Jmeter nos facilitarán la tarea de simular múltiples escenarios de concurrencia con inyección de anomalías en el sistema. Durante esta fase de pruebas es posible que tengamos que realizar ajustes de dimensionamiento, modificar alguna política de escalado o incluso que identifiquemos cuellos de botella y los equipos de desarrollo tengan que ajustar algún componente.
Para no desvirtuar el objetivo del workshop con la definición de SLIs/SLOs/SLAs (más info aquí), únicamente vamos a utilizar la métrica “Ratio de error”, la cual vamos a establecer en < 2,00%.
Planteamos un escenario ficticio donde nuestra aplicación tiene 200 usuarios concurrentes durante la mayor parte del tiempo de servicio.
Procedemos a descargar el binario de JMeter y unos complementos para la visualización de gráficas:
JMeter requiere Java JRE. En el caso de no estar disponible en el sistema, puedes realizar la instalación de [OpenJDK](https://adoptopenjdk.net/index.html). En caso contrario, omite este paso.
curl -L https://ftp.cixug.es/apache//jmeter/binaries/apache-jmeter-5.4.1.tgz --output /tmp/apache-jmeter.tgz
tar zxvf /tmp/apache-jmeter.tgz && mv apache-jmeter-5.4.1 apache-jmeter

# install plugins-manager
curl -L https://jmeter-plugins.org/get/ --output apache-jmeter/lib/ext/jmeter-plugins-manager-1.6.jar

# install bzm - Concurrency Thread Group
curl -L https://repo1.maven.org/maven2/kg/apc/jmeter-plugins-casutg/2.9/jmeter-plugins-casutg-2.9.jar --output apache-jmeter/lib/ext/jmeter-plugins-casutg-2.9.jar
curl -L https://repo1.maven.org/maven2/kg/apc/jmeter-plugins-cmn-jmeter/0.6/jmeter-plugins-cmn-jmeter-0.6.jar --output apache-jmeter/lib/jmeter-plugins-cmn-jmeter-0.6.jar
curl -L https://repo1.maven.org/maven2/kg/apc/cmdrunner/2.2/cmdrunner-2.2.jar --output apache-jmeter/lib/cmdrunner-2.2.jar
curl -L https://repo1.maven.org/maven2/net/sf/json-lib/json-lib/2.4/json-lib-2.4.jar --output apache-jmeter/lib/json-lib-2.4-jdk15.jar


curl -L https://repo1.maven.org/maven2/kg/apc/jmeter-plugins-graphs-basic/2.0/jmeter-plugins-graphs-basic-2.0.jar --output apache-jmeter/lib/ext/jmeter-plugins-graphs-basic-2.0.jar
curl -L https://repo1.maven.org/maven2/kg/apc/jmeter-plugins-graphs-additional/2.0/jmeter-plugins-graphs-additional-2.0.jar --output apache-jmeter/lib/ext/jmeter-plugins-graphs-additional-2.0.jar

# Get url service
url=$(minikube service app-sample --url -n "${TESTING_NAMESPACE}")

HOST_APP_SAMPLE=$(echo ${url} | cut -d/ -f3 | cut -d: -f1)
PORT_APP_SAMPLE=$(echo ${url} | cut -d: -f3)
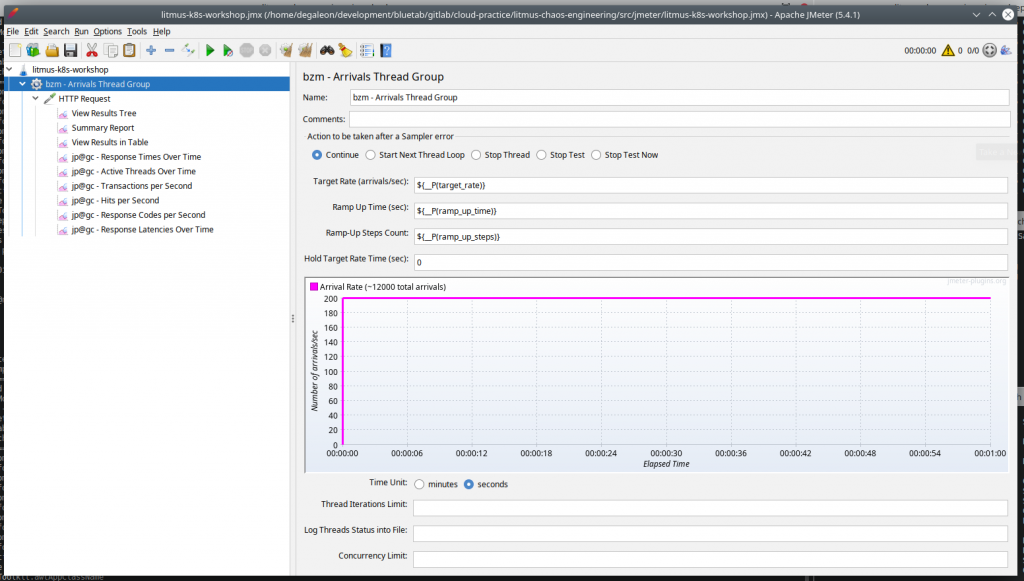
Vamos a validar que con el dimensionamiento actual cumplimos con los requisitos. Durante 60 segundos, ejecutamos 200 peticiones concurrentes, lo que se traduce en 12.000 peticiones. La petición será de tipo “GET” por el puerto 80 del balanceador.
Este es el aspecto que tiene la GUI de JMeter con el plan de pruebas.
TARGET_RATE=200
RAMP_UP_TIME=60
RAMP_UP_STEPS=1

# GUI mode
bash apache-jmeter/bin/jmeter.sh -t src/jmeter/litmus-k8s-workshop.jmx -f -l apache-jmeter/logs/result.jtl -j apache-jmeter/logs/jmeter.log -Jhost=${HOST_APP_SAMPLE} -Jport=${PORT_APP_SAMPLE} -Jtarget_rate=${TARGET_RATE} -Jramp_up_time=${RAMP_UP_TIME} -Jramp_up_steps=${RAMP_UP_STEPS}
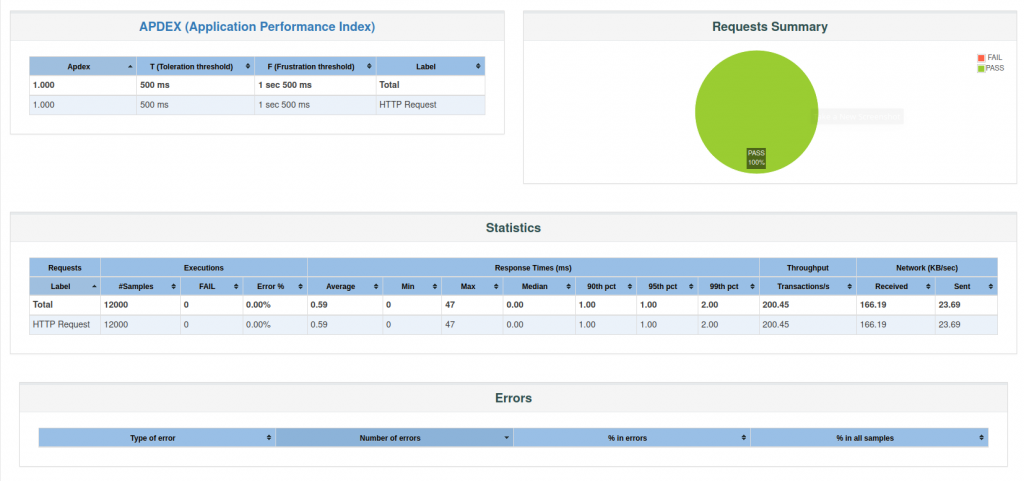
Nuestro dimensionamiento base son dos réplicas de nuestro servicio app-sample:
kubectl get pods -n "${TESTING_NAMESPACE}"

# ----------------------------------------

NAME                         READY   STATUS    RESTARTS   AGE
app-sample-d9d578cfb-55flr   1/1     Running   8          3h1m
app-sample-d9d578cfb-klmxn   1/1     Running   0          3h2m
Ejecutamos el plan de pruebas sin GUI:
TARGET_RATE=200
RAMP_UP_TIME=60
RAMP_UP_STEPS=1

bash apache-jmeter/bin/jmeter.sh -n -t src/jmeter/litmus-k8s-workshop.jmx -f -l apache-jmeter/logs/result.jtl -j apache-jmeter/logs/jmeter.log -Jhost=${HOST_APP_SAMPLE} -Jport=${PORT_APP_SAMPLE} -Jtarget_rate=${TARGET_RATE} -Jramp_up_time=${RAMP_UP_TIME} -Jramp_up_steps=${RAMP_UP_STEPS}

rm -rf apache-jmeter/logs/report && bash apache-jmeter/bin/jmeter.sh -g apache-jmeter/logs/result.jtl -o apache-jmeter/logs/report
En la ruta “./apache-jmeter/logs/report/index.html” podéis ver un dashboard con los resultados.
Hemos realizado 12000 peticiones con 200 usuarios concurrentes durante 60s. Estos son los resultados:
Vamos a realizar la misma prueba pero inyectando disrupcción de red en uno de los pods, lo que provocará que deje de responder (estado CrashLoopBackOff) y sólo tengamos disponible una réplica.
kubectl apply -f src/litmus/pod-network-loss/pod-network-loss-sa.yaml -n "${TESTING_NAMESPACE}"
kubectl apply -f src/litmus/pod-network-loss/chaos-engine-pod-network-loss.yaml  -n "${TESTING_NAMESPACE}"

TARGET_RATE=200
RAMP_UP_TIME=60
RAMP_UP_STEPS=1

bash apache-jmeter/bin/jmeter.sh -n -t src/jmeter/litmus-k8s-workshop.jmx -f -l apache-jmeter/logs/result.jtl -j apache-jmeter/logs/jmeter.log -Jhost=${HOST_APP_SAMPLE} -Jport=${PORT_APP_SAMPLE} -Jtarget_rate=${TARGET_RATE} -Jramp_up_time=${RAMP_UP_TIME} -Jramp_up_steps=${RAMP_UP_STEPS}

rm -rf apache-jmeter/logs/report && bash apache-jmeter/bin/jmeter.sh -g apache-jmeter/logs/result.jtl -o apache-jmeter/logs/report
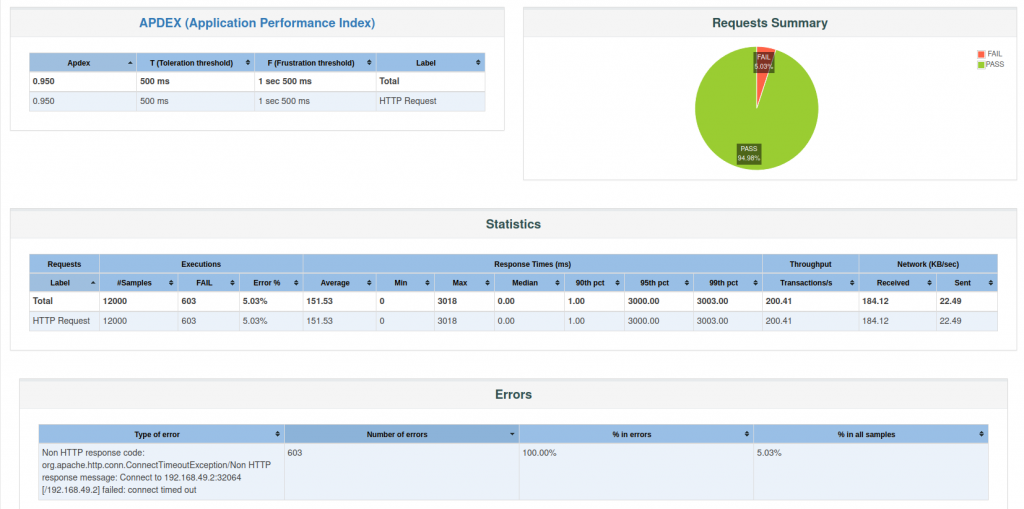
¿Qué ha sucedido?
Al inyectar el experimento, uno de los pods ha dejado de responder. Si nos fijamos en la definición del deployment app-sample, tenemos un livenessProbe cuya propiedad periodSeconds está establecida a 5 segundos y failureThreshold a 1 intento. Según nuestra configuración, el balanceador envía el 50% aprox. del tráfico a cada uno de los pods. Durante 5 segundos tenemos que el pod al que hemos inyectado una disrupción de red mediante el experimento no responde, lo que se traduce en error en la petición. Transcurridos los 5 segundos, el balanceador deja de enviar tráfico a ese pod y sólo tendremos un pod recibiendo peticiones.
Teníamos establecido un requisito que nuestro servicio no puede superar el 2% de errores bajo ningún escenario y hemos obtenido un 5,03% (603 peticiones erróneas), por lo que debemos realizar algún ajuste para cumplir el objetivo.
¿Cuál es el resultado del experimento?
kubectl describe chaosresult app-sample-chaos-pod-network-loss  -n "${TESTING_NAMESPACE}"

#-------------------------

Events:
Type    Reason   Age    From                           Message
----    ------   ----   ----                           -------
Normal  Awaited  4m16s  pod-network-loss-uf6hms-sk47z  experiment: pod-network-loss, Result: Awaited
Normal  Pass     2m23s  pod-network-loss-uf6hms-sk47z  experiment: pod-network-loss, Result: Pass
Aunque nuestro requisito de ratio de error < 2,00% no se cumple, el experimento termina con resultado “Pass”. Esto es debido a que Litmus tiene como criterio de salida “Pass” si el pod vuelve a estar disponible, lo cual se cumple. Aquí estamos haciendo uso de litmus para inyectar errores en el sistema.
¿Cómo podemos conseguir reducir el ratio de error?
Únicamente con fines ilustrativos, para resolver el problema que nos ocupa, vamos a incrementar el número de réplicas a 4 en el HorizontalPodAutoscaler y en el deployment disminuir el valor de la propiedad periodSeconds de 5s a 2s. Con esto pasamos a distribuir el 25% del tráfico a cada pod y además, el tiempo que el pod afectado por la disrupción de tráfico pasa de 5s a 2s, lo que debe traducirse en una reducción del ratio de error.
ℹ️ Nuestro sistema debe estar diseñado para adaptarse a la demanda en base a métricas (CPU, memoria, peticiones por segundo, latencia, I/O, etc.) siempre manteniendo los mínimos recursos activos. Con la expansión de servicios gestionados de kubernetes en los principales proveedores cloud (EKS/GKE/AKS), disponemos de múltiples estrategias para conseguir dicho objetivo.
kubectl edit deployment app-sample -n "${TESTING_NAMESPACE}"

kubectl edit HorizontalPodAutoscaler app-sample-ha -n "${TESTING_NAMESPACE}"
Volvemos a ejecutar nuestro test:
kubectl apply -f src/litmus/pod-network-loss/pod-network-loss-sa.yaml -n "${TESTING_NAMESPACE}"
kubectl apply -f src/litmus/pod-network-loss/chaos-engine-pod-network-loss.yaml  -n "${TESTING_NAMESPACE}"

TARGET_RATE=200
RAMP_UP_TIME=60
RAMP_UP_STEPS=1

bash apache-jmeter/bin/jmeter.sh -n -t src/jmeter/litmus-k8s-workshop.jmx -f -l apache-jmeter/logs/result.jtl -j apache-jmeter/logs/jmeter.log -Jhost=${HOST_APP_SAMPLE} -Jport=${PORT_APP_SAMPLE} -Jtarget_rate=${TARGET_RATE} -Jramp_up_time=${RAMP_UP_TIME} -Jramp_up_steps=${RAMP_UP_STEPS}

rm -rf apache-jmeter/logs/report && bash apache-jmeter/bin/jmeter.sh -g apache-jmeter/logs/result.jtl -o apache-jmeter/logs/report
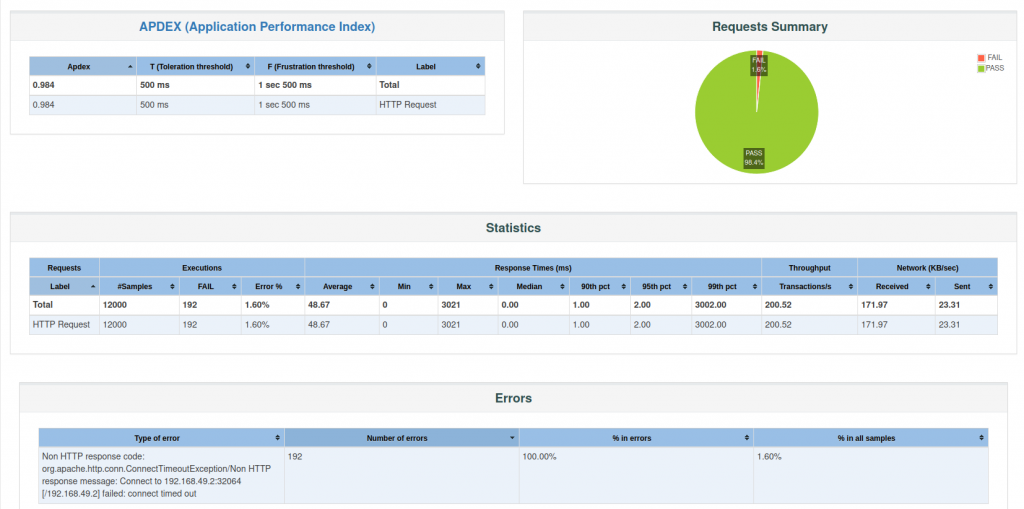
Como podemos observar, nuestros cambios han provocado disminuir nuestro ratio de error a 1,60%, por lo que conseguimos cumplir nuestro objetivo de < 2,00%.
Litmus dispone de un portal para poder realizar experimentos sin necesidad de utilizar la consola. Dispone de las siguientes funcionalidades:
# install litmus portal
kubectl apply -f src/litmus/portal/portal.yaml

minikube service litmusportal-frontend-service -n  ${LITMUS_NAMESPACE} > /dev/null &
En la actualidad, litmus dispone de 53 experimentos a través de Litmus ChaosHub. Están desarrollados principalmente en Go, aunque disponen de una SDK para python y ansible.
Los experimentos tienen una estructura bien definida (pre-checks, chaos-injection, litmus-probes, post-checks y result-updates) y es viable desarrollar experimentos que se ajusten a tus necesidades.
En este enlace encontraréis toda la información para desarrolladores.
Debemos asumir que nuestro sistema no va a ser 100% tolerante a fallos pero ello no implica que pongamos todos los medios para minimizar los riesgos y en caso de producirse el desastre, lo hagamos de una forma relativamente controlada. La clave del éxito pasa por aplicar las prácticas de ingeniería del caos en fases tempranas del desarrollo, conocer las particularidades de la infraestructura donde ejecuta y disponer de herramientas adecuadas para automatizar las pruebas.
Un factor importante es dimensionar los esfuerzos en base a la criticidad del servicio que presta nuestro sistema: el esfuerzo en validar la resiliencia de un portal con información para empleados con 100 usuarios potenciales cuyo SLA es del 98% difiere mucho de una aplicación bancaria que realiza operaciones financieras a miles de usuarios concurrentes cuyo SLA es del 99.9XX%. En ambos casos el único método para verificar el cumplimiento del SLA es mediante test de resiliencia pero existe una notable diferencia respecto al esfuerzo que deberíamos dedicar.
En este workshop nos hemos centrado en Litmus y Kubernetes pero cabe recordar que dependiendo del sistema que estemos desarrollando, tengamos que complementar nuestras pruebas con otras herramientas, principalmente las enfocadas a la inyección de fallos sobre infraestructura (+ info).
Este workshop está licenciado bajo MIT (ver LICENSE para más detalle).
Creación de entorno de pruebas K8s con minikube
Despliegue de aplicación de test
Despliegue servicios monitorización: Prometheus + Grafana
Creación de anotación “litmuschaos”
Detalle componentes de un experimento
LitmusChaos + Load Test Performance con Apache Jmeter
Ángel Maroco llevo en el sector IT más de una década, iniciando mi carrera profesional con el desarrollo web, pasando una buena etapa en distintas plataformas informacionales en entornos bancarios y los últimos 5 años dedicado al diseño de soluciones en entornos AWS.
En la actualidad, compagino mi papel de arquitecto junto al de responsable de la Pŕactica Cloud /bluetab, cuya misión es impulsar la cultura Cloud dentro de la compañía.
SOLUCIONES, SOMOS EXPERTOS
Te puede interesar


by Bluetab
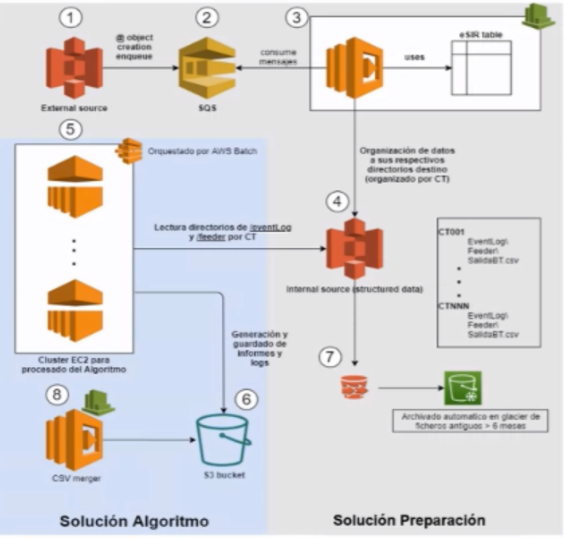
Supply records x 6 months historical logs = +720M
Records in transformers x 6 months historical logs = +214MM
SOLUTIONS, WE ARE EXPERTS
You may be interested in


by Bluetab

Consultor BI

That when distributing what you built, to who needs it, you will be able to do it quickly, simply and without worrying about pre-installing, because everything will be defined from the time when you started building.
When you specify the environment you need, you can replicate it in development, production or on whatever computer you want without extra effort. Ensuring that as long as you have Docker, it will run properly
«Docker was created in 2013, but if you still don’t know it, 2021 will be the year you start using it. StackOverflow now has it rated second among the platforms that developers love most and in first place as the one they want most.»
Let’s take a closer look at what Docker is and how it works. If you have already had an initial encounter with this tool, you will have read or heard about the containers.
Starting with the fact that containers are not unique to Docker. There are Linux containers, which allow applications to be packaged and isolated to enable them to run in different environments. Docker was developed from LXN, but has deviated from it over time.
And Docker takes it to the next level, making it easy to create and design containers with the aid of images.
Images can be seen as templates that contain a set of instructions in order, which are used to create a container and how this needs to be done.
Docker Hub is now the world’s largest library and community for container images, where you can find images, obtain them, share what you create and manage them. You just need to create an account. Do not hesitate to go and explore it when you finish reading.
Now imagine you are developing a web application, you need an Apache HTTP service in its version 2.5 and a MongoDB service in its latest version.
You could set up a container for each service or application with the help of predefined images you got from Docker Hub and they can communicate with each other with the aid of Docker networks.
Using MongoDB, but with its stored database information coming from your preferred provider’s cloud service. This can be replicated in the development and production environment in the same way, quickly and easily.

One difference is that containers make the operating system virtual instead of hardware.
If we look at other aspects, as well as multiple virtual machines can run in a single one, containers can do the same, but containers take less time to start up.
And while each virtual machine includes a complete copy of an operating system, applications, etc., containers can share the same OS kernel, which can make them lighter. Container images are typically tens of MB in size, while virtual machines can take up tens of GB.
There are more things that I invite you to look out for, because this does not mean we stop using virtual machines or that Docker is better, just that we have another option.
Having containers running within virtual machines has become more complex and flexible
You can download and install Docker on multiple platforms (MAC, Windows and Linux) and you can consult the manual from the official website.
There are also several cloud service providers that let you use it.
You also have the alternative of trying out Docker without installation with Play with Docker. As the name says, you can play with Docker by downloading images or repositories to run containers in Play with Docker instances. All at your fingertips with a Docker Hub account.
Now you know more about the issues that exist in development, what Docker is and that it works as a solution, a little about its system of containers and images that you can create or get from Docker Hub. You understand some differences between Virtual Machines and Docker. That docker is multi-platform and you can experiment with it without installing it on your computer with Play with Docker.
Today more and more job offers are requesting Docker, including as a value added to the requirements needed to fill a job post. Remember that if you are in the world of software development, if you want to build, distribute and run code wherever, easily, solve your problems, experiment in new technologies, learn and understand the idea of the title in this article… You need to learn Docker.
SOLUTIONS, WE ARE EXPERTS
You may be interested in


by Bluetab

Senior Cloud Solution Architect

Amazon Redshift can be considered to be one of the most important data warehouses currently and AWS offers it in its cloud. Working at Bluetab, we have had the pleasure of using it many times during our good/bad times as well as this year 2020. So we have created a list with the most common errors you will need to avoid and we hope this will be a great aid for you.
At Bluetab we have been working around data for over 10 years. In many of them, we have helped in the technological evolution of numerous companies by migrating from their traditional Data Warehouse analytics and BI environments to Big Data environments.
Additionally, at Cloud Practice we have been involved in cloud migrations and new developments of Big Data projects with Amazon Web Services and Google Cloud. All this experience has enabled us to create a group of highly qualified people who think/work in/for the cloud
To help you with your work in the cloud, we want to present the most common mistakes we have found when working with Redshift, the most important DW tool offered by AWS.
Here is the list:
Amazon Redshift is a very fast, cloud-based analytical (OLAP) database, fully managed by AWS. It simplifies and enhances data analysis using standard SQL compatible with most existing BI tools.
The most important features of Amazon Redshift are:
Amazon Redshift is not the same as other SQL database systems. Good practices are required to take advantage of all its benefits, so that the cluster will perform optimally.
A very common mistake made when starting to use Redshift is to assume that it is simply a vitamin-enriched PostgreSQL and that you can start working with Redshift based on a schema compatible with that. However, you could not be more wrong.

Although it is true that Redshift was based on an older version of PostgreSQL 8.0.2, its architecture has changed radically and has been optimised over the years to improve performance for its strictly analytical use. So you need to:
When designing the database, bear in mind that some key table design decisions have a considerable influence on overall query performance. Some good practices are:
DISTKEY type. This will distribute the data to the various nodes grouped by the chosen key values. This will enable you to perform JOIN type queries on that column very efficiently.ALL type. It is advisable to copy those tables commonly used in joins of dictionary type to all the nodes. In that way the JOIN statement with much bigger fact tables will execute much faster.EVEN type. The data will be distributed randomly in this way.As Redshift is a distributed MPP environment, query performance needs to be maximised by following some basic recommendations. Some good practices are:
SELECT *. and include only the columns you need.WHERE statement to restrict the amount of data to be read.GROUP BY and SORT BY clauses so that the query planner can use more efficient aggregation.Loading very large datasets can take a long time and consume a lot of cluster resources. Moreover, if this loading is performed inappropriately, it can also affect query performance.
This makes it advisable to follow these guidelines:
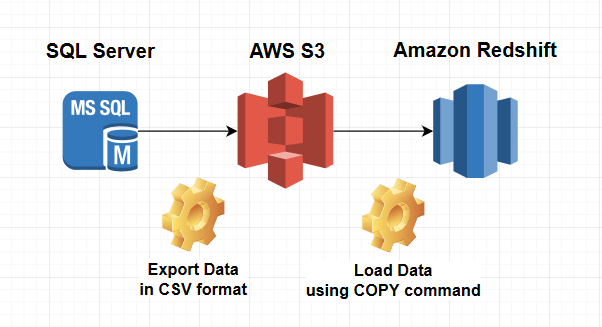
Always use the COPY command to load data in parallel from Amazon S3, Amazon EMR, Amazon DynamoDB or from different data sources on remote hosts.
copy customer from 's3://mybucket/mydata' iam_role 'arn:aws:iam::12345678901:role/MyRedshiftRole'; If possible, launch a single command instead of several. You can use a manifest file or patterns to upload multiple files at once.
Split the load data files so that they are:
To update data and insert new data efficiently when loading it, use a staging table.
  -- Create an staging table and load it with the data to be updated
  create temp table stage (like target);

  insert into stage
  select * from source
  where source.filter = 'filter_expression';

  -- Use an inner join with the  staging table to remove the rows of the target table to be updated

  begin transaction;

  delete from target
  using stage
  where target.primarykey = stage.primarykey;

  -- Insert all rows from the of the staging table.
  insert into target
  select * from stage;

  end transaction;

  -- Drop the staging table.
drop table stage; Over the years we have seen many customers who had serious performance issues with Redshift due to design failures in their databases. Many of them had tried to resolve these issues by adding more resources to the cluster rather than trying to fix the root problem.
Due to this, I suggest you follow the flow below to dimension your cluster:
Collect information on the type of queries to be performed, data set size, expected concurrency, etc.
Design your tables based on the queries that will be made.
Select the type of Redshift instance (DC2, DS2 or RA3) depending on the type of queries (simple, long, complex…).
Taking the data set size into account, calculate the number of nodes in your cluster.
# of Redshift nodes = (uncompressed data size) * 1.25 / (storage capacity of selected Redshift node type) « For storage size calculation, having a larger margin for performing maintenance tasks is also recommended »
Perform load tests to check performance.
If it does not work adequately, optimise the queries, even modifying the design of the tables if necessary.
Finally, if this is not sufficient, iterate until you find the appropriate node and size dimensioning.
It is quite likely that your use case will require multiple sessions or users running queries at the same time. In these cases, some queries can consume cluster resources for extended periods of time and affect the performance of the other queries. In this situation, simple queries may have to wait until longer queries are complete.
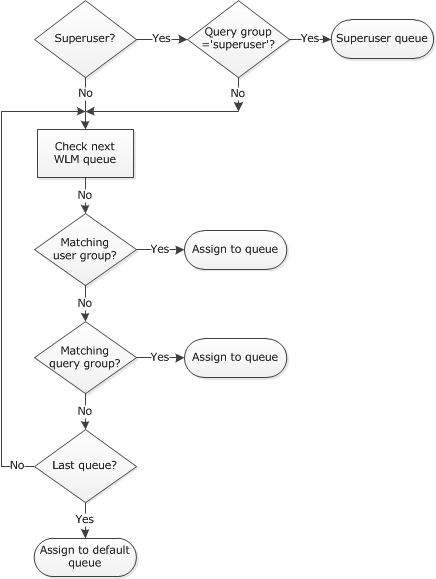
By using WLM, you will be able to manage the priority and capacity of the different types of executions by creating different execution queues.
You can configure the Amazon Redshift WLM to run in two different ways:
When a user runs a query, WLM assigns the query to the first matching queue, based on the WLM queue assignment rules.
Database maintenance is a term we use to describe a set of tasks executed with the intention of improving the database. There are routines to help performance, free up disk space, check data errors, check hardware faults, update internal statistics and many other obscure (but important) things.
In the case of Redshift, there is a mistaken feeling that as it is a service fully managed by Amazon, there is no need for any. So you create the cluster and forget about it. While AWS makes it easy for you to manage numerous tasks (create, stop, start, destroy or perform back-ups), this could not be further from the truth.

The most important maintenance tasks you need to perform in Redshift are:
VACUUM and it needs to be run manually to be able to use SORT KEYS of the INTERLEAVED type. This is quite a long and expensive process that will need to be performed, if possible, during maintenance windows.STV_LOAD_STATE where you can find information on the current status of the COPY instructions in progress. You should check them often to confirm that there are no data integrity errors.STL_ALERT_EVENT_LOG or through the AWS web console itself.My name is Álvaro Santos and I have been working as Solution Architect for over 5 years. I am certified in AWS, GCP, Apache Spark and a few others. I joined Bluetab in October 2018, and since then I have been involved in cloud Banking and Energy projects and I am also involved as a Cloud Master Partitioner. I am passionate about new distributed patterns, Big Data, open-source software and anything else cool in the IT world.
SOLUTIONS, WE ARE EXPERTS
You may be interested in


by Bluetab

After the last HashiConf Digital, the Cloud Practice wants to present you one of the main innovations that were presented: Boundary. In this post we are going to discuss what offers this new tool, why it is interesting, what we have found and how we have tested it.
Hashicorp Boundary is, as themselves claim, a tool that allows access any system using identity as a fundamental piece. What does this really mean?
Traditionally, when a user acquires the permission to access a remote service, he or she also gets explicit permission to the network where the service resides. However, Boundary, following the minimum privilege principle, provides us with an identity-based system for users who need access to applications or machines. For example, it is an easy way of access to a server via SSH using ephemeral keys as authentication method.
This means that Boundary limits what resources you can connect to and also manages the different permissions and accesses to resources with an authentication.
It is especially interesting because in the future it will be marked by the strong integration that it will have with other Hashicorp tools, especially Vault for credentials management and audit capabilities.
In case you are curious, Hashicorp has released the source code of Boundary which you have available at Github and the official documentation can be read on their website:
boundaryproject.
BBased on an example project from Hashicorp, we have developed a small proof of concept that deploys Boundary in a hybrid-cloud scenario in AWS and GCP. Although the reference architecture does not said nothing about this design, we wanted to complete the picture and
set up a small multi-cloud stage to see how this new product.
The final architecture in broad terms is:

Once the infrastructure has been deployed and the application configured, we have tested connecting to the instances through SSH. All the source code is based on terraform 0.13 and you can find it in Bluetab-boundary-hybrid-architecture, where you will also find a detailed README that specifies the actions you have to follow to reproduce the environment, in particular:
In this particular scenario, the target is composed by two different machines:
one in AWS and one in GCP. If Boundary is not told which particular instance you want to access from that target, it will provide access to one of them randomly. Automatically, once you have selected the machine you want to access, Boundary will route the request to the appropriate worker, who has access to that machine.
Considering the level of progress of the current product development, we would be missing for understanding and trying to:
Once the product has completed several phases in the roadmap that Hashicorp has established, it will greatly simplify resources access management through bastions in organizations. Access to instances can be managed simply by adding or modifying the permissions that a user has, without having to distribute ssh keys, perform manual operations on the machines, etc.
In summary, this product gives us a new way to manage access to different resources. Not only through SSH, but it will be a way to manage access through roles to machines, databases, portals, etc. minimizing the possible attack vector when permissions are given to contractors. In addition, it is presented as a free and open source tool, which will not only integrate very effectively if you have the Hashicorp ecosystem deployed, but will also work seamlessly without the rest of Hashicorp’s tools.
We encountered a problem caused by the way in which the information about the network addresses of controllers and workers for subsequent communication was stored. After running our scenario with a workaround based on iptables we decided to open a issue on Github. In only one day, they solved the problem by updating their code. We downloaded the new version of the code, tested it and it worked perfectly. Point in favour for Hashicorp for the speed of response and the efficiency they demonstrated. In addition, recently it has been published a new release of Boundary, including this fix along with many other features Boundary v0.1.2.
SOLUCIONES, SOMOS EXPERTOS
Te puede interesar