• Skip to primary navigation
  • Skip to main content
  • Skip to footer
Bluetab

Bluetab

an IBM Company

  • SOLUTIONS
    • DATA STRATEGY
    • Data Readiness
    • Data Products AI
  • Assets
    • TRUEDAT
    • FASTCAPTURE
    • Spark Tune
  • About Us
  • Our Offices
    • Spain
    • Mexico
    • Peru
    • Colombia
  • talent
    • Spain
    • TALENT HUB BARCELONA
    • TALENT HUB BIZKAIA
    • TALENT HUB ALICANTE
    • TALENT HUB MALAGA
  • Blog
  • EN
    • ES

Bluetab

Quality of insurance information data

November 16, 2020 by Bluetab

Quality of insurance information data

Our client is a major financial institution with presence mainly in Europe and America; among the three largest insurers in the market in Mexico and also a leader in the regions where it operates. It has undertaken a digital transformation in recent years, creating a state-of-the-art technology platform.

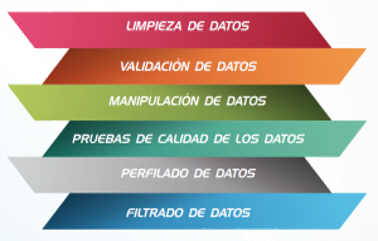
We at Bluetab Mexico are one of the group’s main partners and we collaborated with them by carrying out a thorough analysis to identify data quality problems in IT assets in their Insurance arm; performing re-engineering from the root of some processes to ensure information quality; as well as developing and automating processes to structure day-to-day information so that this meets the standards set in our client’s Big Data platform.

The scope of this project is to provide our client with mechanisms to let them take advantage of one of their competitive advantages, using the information they have about their clients in one of the largest portfolios in the country, and transform it into knowledge to offer them a better experience through a personalised offering.

An additional benefit is having reliable, available, ordered information of adequate quality to meet their needs for their regulatory and decision-making processes.

SUCCESS STORIES

Filed Under: Casos Tagged With: data-fabric

Data-Driven Agriculture; Applied Big Data, Cloud & AI

November 4, 2020 by Bluetab

Data-Driven Agriculture; Applied Big Data, Cloud & AI

José Carranceja

Director Operaciones América

A few weeks ago a customer asked us to explain how the three big clouds were positioned in the world of agriculture. It really is not an easy question to answer, but I will try to summarise some elements that, from my experience, are relevant to the application status of the latest data technologies in the sector. This is a sector in which the coronavirus pandemic and its impact on the shortage of workers has led to increased interest in investment in robotics and automation.

Throughout the agri-food market value chain there are really endless solutions for applying advanced analytics technologies, starting with solutions close to the end customer under the umbrella of CRM and Social Marketing, through solutions for automation of production processes under ERP and the robotisation of operations and, of course, solutions for the whole logistics chain in the SCM field, from optimisation of routes to optimisation of warehoused assets. But perhaps less well-known and more specific to agriculture are those solutions close to the initial processes in crops and the production of raw material for food.

This market has probably been reluctant to implement substantial digital transformation projects, therefore marginal for big players, due to the great spread of producers and their limited coordination in public initiatives. But even so, relevant brands such as Syngenta, DJI, Slantrange and John Deere are now unquestionable examples of the application of the latest data and analytics technologies in the industry.

In the production phases, the combination of sensors, drones, image recognition, thermography and spectrography, autonomous vehicles and biotechnology have achieved further increases in production capacities and drastic reductions in labour, chemical consumables and water use.

Today, in addition to advances in weather forecasting systems, GPS systems and satellite photography, drones are one of the areas seeing most development. These platforms provide detailed information on hydrological status, crop ripening and plant health status. The cameras that drone platforms such as DJI now carry enable from surveying three-dimensional geometries of the ground to accurately identifying to centimetre precision where to apply water or plant protection products and to the most suitable time for harvesting each square metre. All this via services available on cloud platforms, using available algorithms capable of identifying crop numbers and sizes or specific pests and their location.

These are technologies where massive image processing (graphics, thermal or spectrographic images) and pattern identification are key elements.

The great evolution products of chemical or biological origin are undergoing is not to be forgotten. Syngenta, which leads in production of fertilisers, seeds and plant protection products, annually promotes its Crop Challenge in Analytics, where it presents awards to analytical projects worldwide for development of efficient and sustainable systems.

A key feature of this sector are the marketplaces; in addition to the integrated cloud solutions that process images, deliver results and generate the decisions that come with them, these marketplaces also provide the parametrisable algorithms and models to apply them to your data. Slantrange internationally and Hemav in Spain are benchmarks for these integrated cloud platforms. And platforms such as Keras and Caffe avoid the need to beat your brains developing algorithms. You simply need to find the most suitable ones, parametrise them for your data set and make them compete with one another to find the most efficient. New models are emerging at Open AI every 18 months.

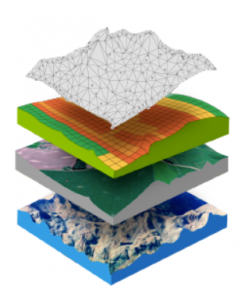
Another fundamental element is the open data platforms, from meteorological, satellite or geological to historical data in certain geographical areas. Crossing these with your own data enables from improved prediction of weather phenomena and their impact on crop ripening to predicting future crop volume and its value on the market.

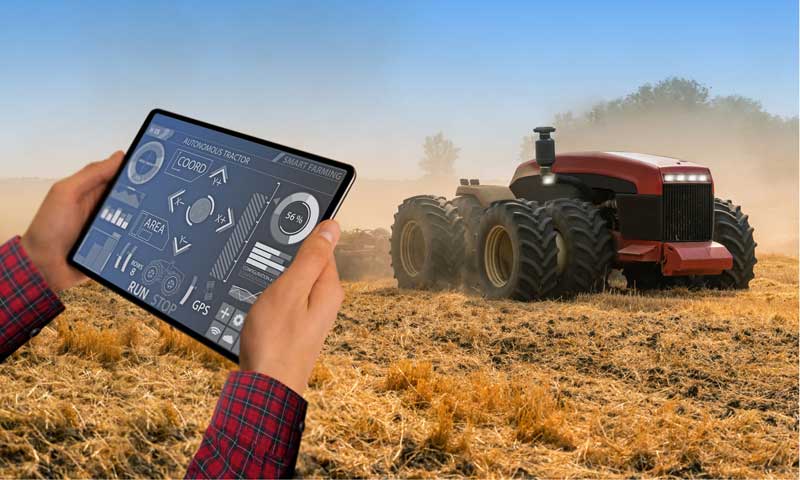
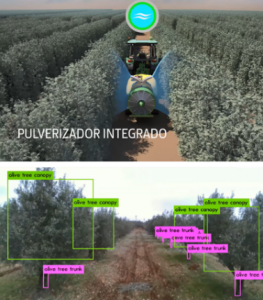
Finally, a differentiating element is the self-driving vehicles from companies such as John Deere, which manufactures tractors that use the same artificial intelligence models as used in self-driving cars as sophisticated as Alphabet’s Waymo. Image recognition models allow for positioning and measurement actions that reduce herbicide or fertiliser applications by 70 to 90%. It should be noted that approximately 50% of fertilisers are lost to the environment under normal conditions.

In this context, the magazine 360 Market Updates identifies, in its 2020 report for the market it calls “Global Connected Agriculture”, expected CAGR growth of 17.08% during the 2020-2024 period. And the big players are not oblivious to this view.


Attempting to discriminate the main players in cloud services, Google GCP, Amazon AWS and Microsoft Azure are now the distinct leaders in both infrastructure and in analytics or BI platforms, according to Gartner. But it is difficult to identify the most suitable for a generic requirement, even by dropping to a preliminary level of detail.

In our analysis of the three platforms in which we have assessed core extraction, integration, and governance capabilities, we conclude that all three have services capable of providing equivalent coverage. Obviously the pricing policies of all of them are adapted to the requirements of each situation under the same terms of competitiveness.

However, coming down to the level of solutions for the agri-food sector, it is AWS and Azure which have developed specific approximation models. They have both developed integration platforms for IoT solutions, integrated services for information dumping from all types of sensors, devices or machines, and enabled services to do so by both streaming and by batch.

Both AWS and Azure have partners that support the extraction processes of these IoT platforms and ensure communications and data capture. But perhaps Microsoft has gone a step further by investing in partners with specific end-to-end solutions in the segment, which are differential in the market. One example of this is Slantrange, which covers the entire process that drones perform, from the generation of flight plans to the processing of both thermal and thermographic images and their exploitation for decision-making by farmers. And along the same lines, Microsoft has reached agreements with market-leading drone platforms, such as DJI and AirMap, and has developed a 3D Drone Flight Simulator. This entire strategy, focused on the source link of the business chain, provides an additional step for data preparation prior to processing on its artificial intelligence platforms.

The Azure FarmBeats service enables creation of a specialised space for the farmer where drone or satellite image processing capabilities are integrated, as well as analysis algorithms for decision-making on crops.

At Bluetab we see how the three platforms’ services are currently undergoing extraordinary evolution and all three have entered a fierce race to ensure that they are matching up to the services of their closest competitors. Any of the so-called “killer applications”, such as Kubernetes or kafka, are now available on all three and they allow for previously unthinkable levels of service integration.  Therefore, in the analysis for the decision on the Platform, other important decision variables also need to be included, such as the level of implementation of the Platform in your local market and the availability of trained resources, integration with your current on-premises platforms or the commercial policies of each.

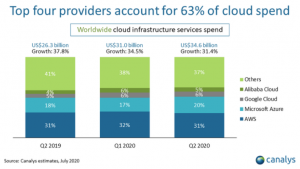
We could say in general terms that the AWS platform currently leads its competitors in terms of market position, although it has seen a small drop in its position in the last year. And this means that, in markets such Spain and Mexico, our perception is that the number of resources available is also greater.

However, it is clear that the pre-existing level of Microsoft solutions in the corporate market and the integration facilities of its entire Office platform, with specific solutions such as Power BI, mean that users’ affinity position Azure as the most sought-after alternative solution. Power BI is currently one of three leading operating platforms, together with Tableau and Qlik.

On the other hand, Google, with GCP, focuses its strategy on its specific artificial intelligence and machine learning solutions, such as its natural language or image recognition solutions and its TensorFlow platforms. All this is supported by integration with its well-known service platforms, such as Maps and Ads. And this means that its third player position is becoming more secure.

Finally, there are two additional points to consider. The first is that the multi-cloud concept is increasingly becoming a reality and tools such as VM Ware enable integrated management solutions for coexistence of different solutions with different clouds. Therefore, and this is the second point, the specific requirements of each service need to be evaluated to assess whether any of them have a higher level of development. So, for example, in terms of gaming platforms, Microsoft would appear to be the leader with its XBox, but now Lumberyard, the video games engine, and Twitch, both of AWS, and Google Stream are coming up strong. And as in this, the three competitors reposition themselves in all segments within a few months, so the differentiating windows are sometimes marginal.

An exciting market, where the three platforms – AWS GCP and Azure – make access increasingly difficult for others such as Alibaba, IBM and other competitors, and sink deeper into their position, generating actual oligopolies… but that complex matter will be addressed on another occasion.

Do you want to know more about what we offer and to see other success stories?
DISCOVER BLUETAB
José Carranceja
Director Operaciones América

Currently Bluetab COO for America, he has developed his professional career in various international management positions in sales and consulting areas in companies such as IBM, BT and Bankinter. He has also led entrepreneurship initiatives such as JC Consulting Ass. in technology consulting and Gisdron, a drone services start-up. He is an Architect specialising in structural calculation and has been trained in graduate schools such as IESE, INSEAD and TEC of Monterrey, Mexico.

SOLUTIONS, WE ARE EXPERTS

DATA STRATEGY
DATA FABRIC
AUGMENTED ANALYTICS

You may be interested in

Databricks on AWS – An Architectural Perspective (part 1)

March 5, 2024
READ MORE

LakeHouse Streaming on AWS with Apache Flink and Hudi (Part 1)

April 11, 2023
READ MORE

Snowflake Advanced Storage Guide

October 3, 2022
READ MORE

Snowflake, el Time Travel sin DeLorean para unos datos Fail-Safe.

February 23, 2023
READ MORE

5 common errors in Redshift

December 15, 2020
READ MORE

MDM as a Competitive Advantage in Organizations

June 18, 2024
READ MORE

Filed Under: Blog, Uncategorized, tendencias

Bluetab is certified under the AWS Well-Architected Partner Program

October 19, 2020 by Bluetab

Bluetab is certified under the AWS Well-Architected Partner Program

Bluetab

In our journey as benchmarks specialising in Data Solutions, /bluetab has earned certification under the AWS Well-Architected Partner Program. This enables us to partner our clients in designing and optimising workloads based on recommended AWS best practices. 
Our Professional Excellence DNA accredits us in establishing good architectural habits, minimising risk and responding speedily to changes that impact designs, applications and workloads.
If you are an AWS customer and need to create high-quality solutions or monitor your workload status, do not hesitate to contact us at inquiries@beta.bluetab.net.

What do we do with WAPP?

Establish technical, tactical and strategic measures to take advantage of the opportunities for improvement in each of the various areas

Cost optimisation
Identifying recurring replaceable actions or unnecessary parts to reduce costs

Security
Establishing data and system risks

Efficiency
Setting the resources necessary to avoid duplicities, overloads or any other inefficiencies

Excellence
Monitoring and controlling execution to make continual improvements and maintain the other pillars appropriately

Reliability
Visualising the errors that affect the client, correcting and recovering them quickly

Do you want to know more about what we offer and to see other success stories?
DISCOVER BLUETAB

SOLUTIONS, WE ARE EXPERTS

DATA STRATEGY
DATA FABRIC
AUGMENTED ANALYTICS

You may be interested in

Boost Your Business with GenAI and GCP: Simple and for Everyone

March 27, 2024
READ MORE

Azure Data Studio y Copilot

October 11, 2023
READ MORE

Cómo preparar la certificación AWS Data Analytics – Specialty

November 17, 2021
READ MORE

Some of the capabilities of Matillion ETL on Google Cloud

July 11, 2022
READ MORE

Cómo depurar una Lambda de AWS en local

October 8, 2020
READ MORE

Gobierno del Dato: Una mirada en la realidad y el futuro

May 18, 2022
READ MORE

Filed Under: Blog, Noticias

Incentives and Business Development in Telecommunications

October 9, 2020 by Bluetab

Incentives and Business Development in Telecommunications

Bluetab

The telecommunications industry is changing faster than ever. The growing proliferation of competitors forces operators to consider new ways of being relevant to customers and businesses. Many companies have decided to become digital service providers, with the aim of meeting the needs of increasingly demanding consumers.

Telecommunications companies have endured a decade of continual challenges, with the industry subjected to a series of disruptions that push them to innovate to avoid being left behind. The smartphone revolution has led consumers to demand unlimited data and connectivity over other services.

Some studies show that the main challenges facing telecoms operators are growing, disruptive competition, agility, and investment, from which four key messages are drawn for understanding the future of the sector:

1. Disruptive competition tops the list of sector challenges

Platforms like WhatsApp-Facebook, Google and Amazon have redefined the customer experience by providing instant messaging services, which have had a direct impact on demand for services such SMS, drastically decreasing it.

Additionally, the market trend is to offer multi-service packages and to enable the customer to customise them according to their own needs, leading to mergers, acquisitions and partnerships between companies, in order to offer ever more diverse services.

2. Commitment to digital business models and innovation in the customer experience

The great opportunities offered by digitisation have made it the concept that the vast majority of companies in the sector aspire to. It is not surprising that in the telecommunications sector too, attempts are being made to move towards a digital business model.

According to the Vodafone Enterprise Observatory, 53% of companies understand digitisation as the use of new technologies in their business processes and 45% as the use of new technologies to improve customer service.

3. The post-2020 landscape will be transformed by 5G

The new generation of mobile telephony, 5G, that will revolutionise not only the world of communications but the industry of the future, has just reached Spain. The four domestic operators – Telefónica, Orange, Vodafone and MásMóvil – have already launched the first commercial 5G services, although only in major cities, with reduced coverage and greatly limited technical capabilities. This early start has also been influenced by the change that has occurred due to the COVID-19 pandemic, which has revealed the need for good quality connection at all times for smart working, digital education, on-line shopping and the explosion of streaming. Spain has Europe’s most powerful fibre network, but there are still regions without coverage. Thanks to full commitment to FTTH (fibre-to-the-home), Spain has a stable connection that runs from the telephone exchange to home directly. According to data from the Fibre to the Home Council Europe 2020, Spain has more fibre-connected facilities (10,261) than France, Germany, Italy and the United Kingdom put together.

The operators play a leading role with these needs for digitisation.

Measures to be taken into account

Achieving such long-awaited digitisation is not an easy process, and it requires a change in organisational mentality, structure and interaction.

While talent is believed to be a key element for digital transformation, and a lack of digital skills is perceived to be a barrier to that transformation, actions say otherwise. Because only 6% of managers consider growth and retention of talent to be a strategic priority.

Workers’ perspective on their level of work motivation:

  • 40% feel undervalued and unappreciated by their company. This increases the likelihood that employees will look for another job that will give them back their motivation to work.
  • 77% of workers acknowledge that they would get more involved in their work if their achievements were recognised within the organisation.
  • Over 60% of people state that an incentives or social benefits programme contributes to them not wanting to look for another job. This is something for companies to take into account, because it is estimated that retaining talent can generate increases in company profits of between 25% and 85%.

Companies’ perspective on their employees’ level of work motivation:

  • 56% of managers of people say they are “concerned” about their employees leaving the company.
  • 89% of companies believe that the main reason their workers look for another job is to go for higher wages. However, only 12% of employees who change company earn more in their new jobs, demonstrating that it is not economic remuneration alone that motivates the change.
  • 86% of companies already have incentives or recognition systems for their employees.

So, beyond the changes and trends set to occur in this sector, Telecommunications companies need to intensify their talent retention and make it a priority to address all the challenges they face on their journey to digitisation.

A very important measure for retaining and attracting talent is work incentives. Work incentives are compensations to the employee from the company for achieving certain objectives. This increases worker engagement, motivation, productivity and professional satisfaction.

As a result, companies in the sector are increasingly choosing to develop a work incentives programme, where they have previously studied and planned the appropriate and most suitable incentives, depending on the company and the type of employees, with the aim of motivating their workers to increase their production and improve their work results.

In the case of the communications sector, these measures will also increase company sales and profits. Within this sector, sales are made through distributors, agencies, internal sales and own stores, aimed both at individual customers and companies. That is why such importance is given to the sales force, leading to more highly motivated sales people with greater desire to give the best of themselves every day, so leading to improved company profits.

Furthermore, all the areas associated with sales, departments that enable, facilitate and ensure the healthiness of sales, as well as customer service, will be subject to incentives.

For an incentive system to be effective, it is essential for it to be well-defined, well-communicated, understandable and based on measurable, quantifiable, explicit and achievable objectives.

Work incentives may or may not be economic. For the employee, it needs to be something that recompenses or rewards them for their efforts. Only in that way will the incentives plan be effective.

Finally, once the incentives plan has been established, the company needs to assess it regularly, because in a changing environment such as the present, company objectives, employee motivations and the market will vary. To adapt to changes in the market and to the various internal and external circumstances, it will need to evolve over time.

What advantages do incentive systems offer telecoms companies?

Implementing an incentives plan in the company has numerous benefits for workers, but also for companies it:

  • Improves employee productivity
  • Attracts qualified professionals
  • Increases employee motivation
  • Assesses results
  • Encourages teamwork


In one of our telecoms clients, /bluetab
 has developed an internal business tool to calculate incentives for the various areas associated with sales. The work incentives are economic in this case, and performance assessment, associated with meeting their objectives, consists of an economic percentage of their salary. Achieving a series of objectives measures contribution to profitable company growth over a period of time.

The following factors are taken into account in developing the incentives calculation:

  • Policy: Definition and approval of the incentives policy for the various sales segments and channels by HR.
  • Objectives: Distribution of company objectives as spread across the various areas associated with sales.
  • Performance: Performance of the sales force and areas associated with sales over the periods defined previously in the policy.
  • Calculation: Calculation of performance and achievement of objectives, of all the profiles included in the incentive policy.
  • Payment: Addition of payment to the payroll for the corresponding performance-based incentives. Payments will be bimonthly, quarterly, semi-annual or annual.

How do we do it?

/bluetab develops tools for tracking the achievement of objectives and calculation of incentives. This allows everyone related to sales, to whom this model applies, to track their results, as well as the various departments related to their decision, human resources, sales managers, etc.

The most important thing in developing these types of tools is to analyse all the client’s needs, gather all the information necessary for calculating the incentives and fully understand the policy. We analyse and compile all the data sources needed for subsequent integration into a single repository.

The various data sources may be Excel, csv or txt files, the customer’s various information systems, such as Salesforce, offer configuration tools, database systems (Teradata, ORACLE, etc.). The important thing is to adapt to any environment in which the client works.

We typically use processes programmed in Python to extract from all the data sources automatically. We then integrate all the resulting files using ETL processes, performing all the necessary transformations and loading the transformed data into a database system as a single repository (e.g. Teradata).

Finally, we connect the database to a data visualisation tool, such as Power BI. All the incentives calculations are implemented in that tool. Scorecards are then published to share this with the various users, providing security both at access and data protection levels.

As an added value, we include forecasts in two different ways. The first is based on data provided by the customer, reported in turn by the sales force. The second by integrating predictive analysis algorithms using Python, Anaconda, Spider, R which, based on a historical record of the various KPIs, enables estimation of future data with low margins of error. This allows for prediction of the results of future incentives.

Additionally, simulations of the various scenarios can be carried out, using parameters, for calculation of the objectives and achievement of incentives.

The/bluetab tool developed will enable departments affected by incentives to perform daily, weekly, monthly or yearly monitoring of their results in a flexible, dynamic, agile manner. As well as allowing the departments involved in the decisions to monitor the data, it will also enable them to improve future decision making.

Benefits provided by /bluetab

  • Centralisation of information, the chance to perform calculation and monitoring using a single tool.
  • Higher updating frequency: going from monthly and semi-annual updating in some cases to daily, weekly and real-time on occasions.
  • Reduction of 63% in time spent on manual calculation tasks.
  • Greater traceability and transparency.
  • Scalability and depersonalisation of reporting.
  • Errors from manual handling of multiple different sources reduced by 11%. Data quality.
  • Artificial intelligence simulating different scenarios.
  • Dynamic visualisation and monitoring of information.
  • Improved decision-making at the business level.
Do you want to know more about what we offer and to see other success stories?
DISCOVER BLUETAB

SOLUTIONS, WE ARE EXPERTS

DATA STRATEGY
DATA FABRIC
AUGMENTED ANALYTICS

You may be interested in

CDKTF: Otro paso en el viaje del DevOps, introducción y beneficios.

May 9, 2023
READ MORE

Incentives and Business Development in Telecommunications

October 9, 2020
READ MORE

Oscar Hernández, new CEO of Bluetab LATAM.

May 16, 2024
READ MORE

Essential features to consider when adopting a cloud paradigm

September 12, 2022
READ MORE

Mi experiencia en el mundo de Big Data – Parte II

February 4, 2022
READ MORE

LakeHouse Streaming on AWS with Apache Flink and Hudi (Part 2)

October 4, 2023
READ MORE

Filed Under: Blog, tendencias

Cómo depurar una Lambda de AWS en local

October 8, 2020 by Bluetab

Cómo depurar una Lambda de AWS en local

Bluetab

AWS Lambda es un servicio serverless mediante el que se puede ejecutar código sin necesidad de levantar ni administrar máquinas. Se paga solamente por el tiempo consumido en la ejecución (15 minutos como máximo).

El servicio dispone de un IDE simple, pero por su propia naturaleza no permite añadir puntos de ruptura para depurar el código. Seguro que algunos de vosotros os habéis visto en esta situación y habéis tenido que hacer uso de métodos poco ortodoxos como prints o ejecutar el código directamente en vuestra máquina, pero esto último no reproduce las condiciones reales de ejecución del servicio.

Para permitir depurar con fiabilidad desde nuestro propio PC, AWS pone a disposición SAM (Serverless Application Model).

Instalación

Los requisitos necesarios son (se ha usado Ubuntu 18.04 LTS):

  • Python (2.7 ó >= 3.6)
  • Docker
  • IDE que se pueda enlazar a un puerto de debug (en nuestro caso usamos VS Code)
  • awscli


Para instalar la CLI de AWS SAM desde AWS recomiendan brew tanto para Linux como macOS, pero en este caso se ha optado por hacerlo con pip por homogeneidad:

python3 -m pip install aws-sam-cli 

Configuración y ejecución

1. Iniciamos un proyecto SAM

sam init 
  • Por simplicidad se selecciona “AWS Quick Start Templates” para crear un proyecto a través de plantillas predefinidas
  • Se elige la opción 9 – python3.6 como el lenguaje del código que contendrá nuestra lambda
  • Se selecciona la plantilla de “Hello World Example»

En este momento ya tenemos nuestro proyecto creado en la ruta especificada:

  • /helloworld: app.py con el código Python a ejecutar y requirements.txt con sus dependencias
  • /events: events.json con ejemplo de evento a enviar a la lambda para su ejecución. En nuestro caso el trigger será un GET a la API a http://localhost:3000/hello
  • /tests : test unitario
  • template.yaml: plantilla con los recursos de AWS a desplegar en formato YAML de CloudFormation. En esta aplicación de ejemplo sería un API gateway + lamba y se emulará ese despliegue localmente

2. Se levanta la API en local y se hace un GET al endpoint

sam local start-api 

Concretamente el endpoint de nuestro HelloWorld
será http://localhost:3000/hello Hacemos un GET

Y obtenemos la respuesta de la API

3. Añadimos la librería ptvsd (Python Tools for Visual Studio) para debugging a requirements.txt quedando como:

requests
ptvsd 

4. Habilitamos el modo debug en el puerto 5890 haciendo uso del siguiente código en helloworld/app.py

import ptvsd

ptvsd.enable_attach(address=('0.0.0.0', 5890), redirect_output=True)
ptvsd.wait_for_attach() 

Añadimos también en app.py dentro de la función lambda_handler varios prints para usar en la depuración

print('punto de ruptura')

print('siguiente línea')

print('continúa la ejecución')

return {
    "statusCode": 200,
    "body": json.dumps({
        "message": "hello world",
        # "location": ip.text.replace("\n", "")
    }),
} 

5. Aplicamos los cambios realizados y construimos el contenedor

sam build --use-container 

6. Configuramos el debugger de nuestro IDE

En VSCode se utiliza el fichero launch.json. Creamos en la ruta principal de nuestro proyecto la carpeta .vscode y dentro el fichero

{
  "version": "0.2.0",
  "configurations": [
      {
          "name": "SAM CLI Python Hello World",
          "type": "python",
          "request": "attach",
          "port": 5890,
          "host": "127.0.0.1",
          "pathMappings": [
              {
                  "localRoot": "${workspaceFolder}/hello_world",
                  "remoteRoot": "/var/task"
              }
          ]
      }
  ]
} 

7. Establecemos un punto de ruptura en el código en nuestro IDE

8. Levantamos nuestra aplicación con la API en el puerto de debug

sam local start-api --debug-port 5890 

9. Hacemos de nuevo un GET a la URL del endpoint http://localhost:3000/hello

10. Lanzamos la aplicación desde VSCode en modo debug, seleccionando la configuración creada en launch.json

Y ya estamos en modo debug, pudiendo avanzar desde nuestro punto de ruptura

Alternativa: Se puede hacer uso de events/event.json para lanzar la lambda a través de un evento definido por nosotros

En este caso lo modificamos incluyendo un solo parámetro de entrada:

{
   "numero": "1"
} 
Y el código de nuestra función para hacer uso del evento:
print('punto de ruptura número: ' + event["numero"]) 
De esta manera, invocamos a través del evento en modo debug:
sam local invoke HelloWorldFunction -d 5890 -e events/event.json 
Podemos ir depurando paso a paso, viendo como en este caso se hace uso del evento creado:
¿Quieres saber más de lo que ofrecemos y ver otros casos de éxito?
DESCUBRE BLUETAB

SOLUCIONES, SOMOS EXPERTOS

DATA STRATEGY
DATA FABRIC
AUGMENTED ANALYTICS

Te puede interesar

Bank Fraud detection with automatic learning II

September 17, 2020
LEER MÁS

Bank Fraud detection with automatic learning

September 17, 2020
LEER MÁS

Spying on your Kubernetes with Kubewatch

September 14, 2020
LEER MÁS

Mi experiencia en el mundo de Big Data – Parte I

October 14, 2021
LEER MÁS

Starburst: Construyendo un futuro basado en datos.

May 25, 2023
LEER MÁS

How much is your customer worth?

October 1, 2020
LEER MÁS

Filed Under: Blog, Tech

How much is your customer worth?

October 1, 2020 by Bluetab

How much is your customer worth?

Bluetab

Our client is a multinational leader in the energy sector with investments in extraction, generation and distribution, with a significant presence in Europe and Latin America. It is currently developing business intelligence initiatives, exploiting its data with embedded solutions on cloud platforms. 

The problem it had was big because, to generate any use case, it needed to consult countless sources of information generated manually by various departments, including text files and spreadsheets, but not just that, it also had to use information systems ranging from Oracle DB to Salesforce. 

«The problem it had was big because, to generate any use case, it needed to consult countless sources of information generated manually»

The solution was clear; all the necessary information needed to be concentrated in a single, secure, continually available, organised and, above all, cost-efficient place. The decision was to implement a Data Lake in the AWS Cloud.

In project evolution, the client was concerned about the vulnerabilities of its local servers, where they have had some problems with service availability and even the a computer virus intrusion, for which /bluetab proposes to migrate the most critical processes completely to the cloud. These include a customer segmentation model, developed in R. 

Segmenting the customer portfolio requires an ETL developed in Python using Amazon Redshift as DWH, where a Big Data EMR cluster is also run on demand with tasks developed in Scala to handle large volumes of transaction information generated on a daily basis. The process results that were previously hosted and exploited from a MicroStrategy server now were developed in reports and dashboards using Power BI.

«…the new architecture design and better management of cloud services in their daily use enabled us to optimise cloud billing, reducing OPEX by over 50%»

Not only did we manage to integrate a significant quantity of business information into a centralised, governed repository, but the new architecture design and better management of cloud services in their daily use enabled us to optimise cloud billing, reducing OPEX by over 50%. Additionally, this new model enables accelerated development of any initiative requiring use of this data, thereby reducing project cost.

Now our customer wants to test and leverage the tools we put into their hands to answer a more complex question: how much are my customers worth?

Its traditional segmentation model in the distribution business was based primarily on an analysis of payment history and turnover. In this way they predict the possibility of defaults in new services, and the potential value of the customer in billing terms. All of this, crossed with financial statement information, still formed a model with ample room for improvement.

«At /bluetab we have experience in development of analytical models that ensure efficient and measurable application of the most suitable algorithms for each problem and each data set»

At /bluetab we have experience in development of analytical models that ensure efficient and measurable application of the most suitable algorithms for each problem and each data set, but the market now provides solutions as very mature analytical models that, with minimum parametrisation, enable good results while drastically reducing development time. As such, we used a well-proven CLV (Customer Lifetime Value) model to help our client evaluate the potential life-cycle value of its customers.

We have incorporated variables in the new scenario such as After-sales service costs (such as recovery management, CC incident resolution costs, intermediary billing agent costs, etc.), and Provisioning logistics costs into the customers’ income and expense data, making it possible to include data on geographical positioning for distribution costs, market maturity in terms of market share, or crossing with information provided by different market sources. This means our client can make better estimates of the value of its current and potential customers, and perform modelling and forecasting of profitability for new markets or new services.

The potential benefit from application of the analytical models depends on less “sexy” aspects, such as consistent organisation and governance of the data in the back office, the quality of the data provisioning the model, implementation of the model following DevOps best practices and constant communication with the client to ensure business alignment and to be able to extract/visualise conclusions of value from the information obtained. And at /bluetab we believe this is only possible with expert technical knowledge and a deep commitment to understanding our clients’ businesses.

«The potential benefit from application of the analytical models is only possible with expert technical knowledge and a deep commitment to understanding our clients’ businesses»

Do you want to know more about what we offer and to see other success stories?
DISCOVER BLUETAB

SOLUTIONS, WE ARE EXPERTS

DATA STRATEGY
DATA FABRIC
AUGMENTED ANALYTICS

You may be interested in

Data Mesh

July 27, 2022
READ MORE

Basic AWS Glue concepts

July 22, 2020
READ MORE

$ docker run 2021

February 2, 2021
READ MORE

Introduction to HashiCorp products

August 25, 2020
READ MORE

Using Large Language Models on Private Information

March 11, 2024
READ MORE

Leadership changes at Bluetab EMEA

April 3, 2024
READ MORE

Filed Under: Blog, tendencias

  • « Go to Previous Page
  • Page 1
  • Interim pages omitted …
  • Page 8
  • Page 9
  • Page 10
  • Page 11
  • Page 12
  • Interim pages omitted …
  • Page 18
  • Go to Next Page »

Footer

LegalPrivacy Cookies policy

Patron

Sponsor

© 2025 Bluetab Solutions Group, SL. All rights reserved.